April 2000Trading Tip:
Scrolling
Charts
by Howard Arrington
I find it useful to keep my open positions in one trading
account. When that account is displayed, I click the right
mouse button to display the pop-up menu for the trading account and
select the bottom menu item to display a chart. Then I click
on the menu Chart | Auto Scroll. Ensign Windows will cycle
through the symbols on the trading account and display a chart for
each in the open chart window. The duration of time that each
chart is displayed before moving on to the next symbol is set as a
Scroll Speed parameter on the SetUp | Charts form. I like 2 or
3 seconds as the scroll speed.
The auto scroll mode can be stopped by unchecking menu Chart |
Auto Scroll, or by simply closing the open chart window.
After starting the auto scroll feature, I sit back and keep
tabs on all my open positions by watching their charts scroll
through the open chart window. I find I prefer this method of
watching my charts over having lots of tiny charts arranged in rows
and columns on my display.
Tip: The Chart | Auto Scroll feature can also use the
symbol list from a custom quote page. Just display a custom
quote page instead of a trading account.
Tip: All charts will display using the same time frame as
the current chart. So, if you display a daily chart, the
scroll feature will display daily charts for all symbols in the
trading account (or portfolio page). You can change to a
different time frame by using the time buttons on the times
panel, or press a key on the 10-keypad. Chart time
frames are assigned to the keys on the 10-keypad on the SetUp |
Charts form shown below on the Keyboard tab.
Study Insight:
Chart Markers
by Howard Arrington
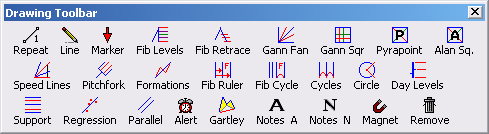
Markers can be placed on charts to mark bars or formations.
A common use is to indicate where a trade was entered or
exited. To place a marker on a chart, click the Arrow button
on the Draw Tools panel.
The cursor will change to a pencil while in draw mode. Move
the pencil to the location for the marker, and click the left mouse
button. A default marker will appear on the chart. You
can now click the right mouse button to display a properties form to
change the marker shape or the text that appears adjacent to the
marker.
Markers can be drawn in a huge variety of shapes. Use the
drop down Marker list to select a marker shape.
Optionally, various words like 'Long', 'Short' and 'Out' can be
displayed with the marker either above or below, on the left or the
right side of the marker.
Tip: Select the marker that you use most frequently, and
then check the 'Use as Default' box on the properties form.
Your choice will display as the default when a new marker is placed
on a chart. My default is the word 'Long' with the Large
Target on the Right of the text. I find that this marker is an
excellent visual indication of where a trade was entered
.
The preview window shows how the marker will look on the
chart. The example shows custom text positioned below the
marker made up of four differently colored dots.
Markers can be repositioned by clicking the left mouse button
down on the marker, and dragging the object to a new position.
The pencil is displayed when a marker is reselected.
When a marker is selected, you can click the right mouse button to
display its properties form.
Tip: A marker can be placed quite easily on the chart
with the mouse. This price can be manually edited to place the
marker exactly on a price, instead of just close to a specific
price.
Click on the color square on the properties form to change the
color of the marker. A new color is selected from the color
dialog form that is displayed.
The chart
objects list is displayed by clicking the chart objects button,
which is the rightmost button on the top row.
The list shows all studies and draw tools that are present on the
chart. An item can be selected by clicking on its name in the
list, and then clicking the button to show its Properties form, or
clicking the button to Remove this object from the
chart. Clicking the All button will remove all objects
from the chart.
Tip: Double clicking on an item in the chart objects list
will display the properties form.
Trader Profile:
Rick Ackerman
ES: Give a brief history of your trading background and
experience.
RA: I was an options market maker and member of the Pacific
Stock Exchange for about twelve years and have traded stocks,
options and commodities off-the-floor for about seven years as a
retail customer. I have also written "The Striking Price" for
Barron's on an occasional basis.
ES: Describe a typical trading day for you.
RA: My agenda is established the night before, when I
analyze stocks and futures for purposes of writing my daily
newsletter. On the commodity side, I've traded mostly S&Ps
in the past but am starting to focus more on equity options.
Usually I aim for just one or two trades during the day, based on
the strategies I've sent out to my subscribers. I am not glued
to the screen and prefer the kind of trades that allow for a relaxed
approach. Although I've found that it is possible to make more
money by following the tick charts and the one-minute bars, it is
too nerve-wracking for me.
ES: What kind of equipment and office set-up do you have
for trading?
RA: I have 2 desktop PCs, a Mac and a Dell laptop. I
follow the markets real-time on a vintage 486 PC, and I write and
publish the newsletter on a PC.
ES: What software do you use to help make trading
decisions, and why?
RA: As a market technician, my bag of tricks and analytical
skills have grown around the capabilities of Ensign, which I've been
using for about six years. Ensign has plenty of bells and
whistles, but without overpowering the user. It is
straightforward, nicely intuitive and very easy to use. There
are some tools that I have found very helpful that may be unique to
Ensign, such as the stochastic crossover "predictor." Howard
Arrington took the trouble to program it into Ensign Windows when I
raved about the Vista version.
ES: What markets do you like to trade?
RA: I like the put and call markets, since options are my
area of greatest expertise. They also provide a very effective
and efficient means of leveraging the kind of strategies I use.
ES: How often do you trade?
RA: When tracking the S&Ps, two or three times a day;
with options, maybe once a day on average. I will soon be
trading in a partnership with a hedge fund and will probably
maintain the same relaxed pace. It's not how often one trades
that matters, but how consistently one is able to profit. The
most compelling reason to trade more frequently is that one will
tend to trade smaller patterns with less dollar risk. That
suits me well, since I'm most comfortable hitting lots of singles
and doubles rather than swinging for the fences.
ES: What are some of your favorite technical studies and
trading tools?
RA: I try to keep it as simple as possible: stochastic,
Fibonacci Levels and, occasionally, candlesticks. If they fail
to yield actionable signals, I will sometimes use Market Profile.
ES: What chart time frames do you like to use, and why?
RA: Although my technical methods can be applied to any
vehicle in any time frame, I've grown most comfortable with the
15-minute chart. It generates signals that are congruent with
the base-hits strategy I favor, and with my conservative approach to
managing risk.
ES: Are you a system trader, or do you use a lot of
personal discretion in your trading?
RA: I'm about 75% mechanical, 25% intuitive. The
intuitive part is being able to answer the question, "How will the
floor traders try to bamboozle me this time?"
ES: Do you use a profit taking or trailing stop technique?
RA: A multi-contract or multi-share entry is essential,
since it allows one to take profits early on, as well as to
eliminate the likelihood of loss. Once you take profits on a
position, you enter a psychological comfort zone that permits you to
make correct decisions much more easily and consistently.
With respect to stops, I apply them rigorously. "Shrinking
trailing stops" are a tool intrinsic to good risk management.
If you buy a stock at 60 in anticipation of a move to 70, how wide
should your trailing stop be when the stock reaches, say, 67?
The answer is: no wider than 1 1/2 points, assuming you want a
risk:reward ratio no worse than 1:2 the whole way up.
In practice, stocks hit my targets about 85% of the time, but I
rarely tell my subscribers to use buy-and-hold strategies.
It's not possible if you are trying to control the risk for the
duration of the trade, as you should.
ES: What kind of system do you use to control losses?
RA: I try to enter positions against the trend. If
you trade with it you'll be in bad company, traveling with the
herd. It is axiomatic that, the more obvious the trend, the
more violent the avoidance maneuvers a stock or futures contract
will take to shake loose the majority who look for -- and act upon
-- the obvious. I strongly prefer shorting rally spikes or
buying at the bottom of pullbacks -- especially when my inflection
points are nowhere near obvious trend lines or
support-and-resistance zones. When I put out an S&P
recommendation in my newsletter, the stop is rarely wider than half
a point (i.e., $125 of risk). If I'm right about the
inflection point, I can lower the stop to break-even right away,
take profits on a piece of the position, then hold the rest, without
risk or fear, for a shot at bigger gains.
ES: What was one of your best trades or experiences?
RA: I spotted the profit motive of a pill tamperer when I
was trading in SmithKline options, eventually receiving a $200,000
reward for bringing his timely purchase of put options to the
attention of the FBI. More recently, I had a 35-point rally in
Microsoft pegged in the newsletter. December 110 calls
purchased for $6 were cashed out for as much as $1,400 apiece.
ES: What was one of your worst trading mistakes?
RA: Failing to cover -- for $25 apiece! -- hundreds of Cray
Research puts that I was short on Friday, October 16, 1987. At
one point on the following Monday they were going for around $3,500
apiece, not that you could have bought any there.
ES: What advice would you give to a new trader?
RA: 1. Be patient, for there is no quick road to
riches. While you are learning, the supply of trading
opportunities is not going to dry up.
2. Before you begin to trade, choose a technical system, any
system, and master it. Start by using it to calibrate your
minute observations of specific stocks and commodities over a period
of 6-12 months. The system itself -- be it Gann angles,
Elliott Wave, or whatever -- is less important than your ability to
understand how trading vehicles move relative to what the system
might predict.
ES: What suggestions would you give for choosing a broker?
RA: Ask a half-dozen traders for recommendations, then use
trial and error. "Low commissions" should be number two on
your list, behind "good executions." For equity options, use
only brokers who understand, and who can handle, "contingency"
orders. There are not many of them around.
ES: What do you think separates very successful traders
from the rest of the pack?
RA: The ability to learn from mistakes (and successes), and
to keep emotions from taking over. If you succeed at the
first, you will gain the confidence it takes to master the second.
|