August 2000Trading Tip:
After Hours
Market
by Howard Arrington
Investors may trade in the After Hours Market (3:00 - 5:30 p.m.
Central Time) on the Nasdaq Stock Market. On a quote page, the
Bid column will show the price a prospective buyer is prepared to
pay at a particular time for trading a security. The Ask
column will show the price at which someone who owns a security
offers to sell a security. During regular market hours, the
last sale is shown in the Last column. However, during the
After Hours session, the last sale is displayed in the Form T
column. The last sale is an electronic entry by a NASD Member
firm representing the price involved in a transaction of a Nasdaq
security. The trade report must be submitted to Nasdaq within
90 seconds after the execution of the trade.
Participation by Market Makers and ECNs in the After Hours Market
is strictly voluntary and as a result may offer less liquidity and
inferior prices. Tip: Investors who anticipate trading
the After Hours Market are strongly advised to use limit orders
because stock prices may move more quickly in this environment.
The following illustration shows After Hours trading, the last
Form T trade, Bid price, and Ask price using Ensign Windows with the
Data Transmission Network data feed.
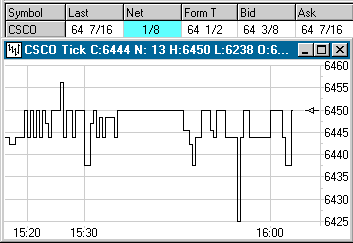
Tip: To enable Ensign Windows to chart the After Hours
data, change the @Nasdaq day session closing time to 17:30 on the
SetUp | Symbol Properties form.
Study Insight:
Forward Shifted Moving
Averages
by Howard
Arrington
A common use of two moving averages is to buy when a faster
moving average crosses above a slower moving average, and sell when
the faster average crosses below the slower average. The
illustration shows a 5-bar simple moving average plotted in dark
blue crossing a 15-bar simple moving average plotted in red.
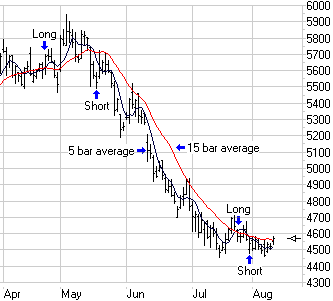
Moving average signals have advantages and disadvantages,
and both are illustrated on this chart. The advantage is that
moving averages work well in trending markets (May -
July). By keeping you in a position, it heeds the counsel to
'let your profits run'. Averages filter out minor market
reactions such as those shown in the first and last weeks of
June. The disadvantage is that moving average signals 'eat you
alive' in choppy markets (April and end of July) because of the lag
time in the signal.
Because of these opposing characteristics of moving averages,
technicians have often sought to optimize the signals by backtesting
various parameter combinations for the two moving averages. In
general, faster averages reduce the lag time for the signal, but
introduce additional whip-lash trades. Slower averages filter
more minor reactions, but increases the lag time which gives back
more profit at major turns.
A compromise that seeks to decrease the lag time, yet still
filter minor reactions, can be found in using a 2nd average that is
a fast moving average forward shifted to the right instead of a
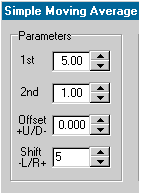
slower moving average. Tip: This is accomplished in
Ensign Windows by adding two moving average studies to a chart, and
setting the Shift parameter for the 2nd average to something like 5
for a displacement 5-bars to the right.
The following chart shows two 5-bar moving averages, yet the 2nd
average is shifted or displaced 5 bars to the right. I call
this a forward shifted moving average. The two averages are
identical in shape because they are both 5-bar moving averages.
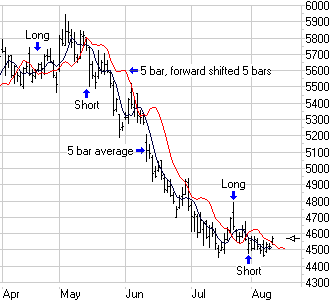
Let's compare the signals on these two charts and talk about some
of the differences. The lag time on the 1st Long signal is
less. The signal is two bars earlier at a close of 5650
instead of at 5700. The 1st Short signal occurs three bars
earlier at a close of 5750 instead of at 5525. Because of the
change in lag time for these two signals the Long position taken in
April changed from a losing trade (Buy 5700, Sell 5525 = 175 loss)
to a winning trade (Buy 5650, Sell 5750 = 100 profit). The
better sell price (5750) also contributes to more profit in the
short position taken in mid May.
However, you will notice these new averages get caught in the
market reaction the first week of June for a whip-lash. The
whip-lash gave back the profit that was gained by having quicker
signals with less lag time.
I made no attempt to optimize the parameters, or to find a
combination that would eliminate the whip-lash. I simply
picked an example chart that had both sideways movement and a nice
trend. This trading tip illustrates the use of a forward
shifted average, and discusses the advantages and disadvantages of
using moving average crossovers to generate buy and sell signals.
Article:
Time and Sales
by Howard Arrington
Time and Sales data shows the time stamp, price and tick
volume for a security, giving a complete price history for a trading
day. Time and Sales is available for any symbol. Ensign
Windows has a powerful search feature to display Time and Sales for
any data collected during the past three days. Time and Sales
is a menu item from several places in Ensign Windows, such as from a
quote page menu or from a chart menu.
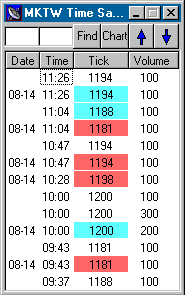
The Time and Sales search capability is used in this
manner. The first edit box can hold a date in the format of
mm-dd. If the box is blank, then today's date is
assumed. The 2nd edit box can hold a time in the format of
hh:mm. If the box is blank, then the latest time stamp on a
given date is assumed. After entering either the date, a time
or both, click the Find button to have the Time and Sales form
display a tick sequence from that point backward.
Example: A Date entry of 08-14
would start the display with the last tick for a symbol stored on
the 14th. The tick sequence would flow to earlier ticks in the
day. A Time of 10:32 would start the display with the ticks
time stamped at 10:32 today, and flow backward to 10:31, 10:30 etc.
To return to a display of the current ticks, double click on
either edit box for the Date or the Time. The double click
will accomplish a clearing of the entries in those boxes and a Find
of the current tick. The current tick is found when a Find is
done and both edit boxes are empty.
The display can be scrolled up or down by clicking the blue arrow
buttons. The scroll is a display set of ticks as a
group. If the form is showing 25 ticks, then a down click will
jump down in the sequence 25 ticks to display the next set of 25
ticks. Down ticks have a red background color and up ticks
have a cyan background color. These colors are selectable on
the bottom of a quote page.
Ticks that are displayed in the Time and Sales form can be viewed
as a chart by clicking the Chart button on the Time and Sales
form. A chart window will open to the right hand side of
the T&S form and show the ticks being viewed. The last
tick on the right hand side of the chart will correspond with the
first tick listed in the T&S form. As the T&S form is
scrolled, the chart will automatically scroll to stay in sync.
The chart bar spacing might be such that the chart displays more
tick data than is shown on the T&S form. The chart has
full capability such as optionally showing the volume, the bar data
panel, and adjustable bar spacing.
Bad ticks can be eliminated from the data set pool by double
clicking on the row showing the tick on the Time and Sales
form. The T&S chart, if showing, will repaint to remove
the deleted tick from its image.
Trader Profile:
Lance Stoker
 Lance is the
owner of 9 grain elevators in Eastern Idaho. Lance is the
owner of 9 grain elevators in Eastern Idaho.
ES: What grain crops are grown in Eastern Idaho?
LS: The largest grain crop is malt barley. The 2nd
largest is soft white wheat closely followed by hard red spring
wheat.
ES: What is the market for these grains?
LS: Malting barley is used by Anheuser-Busch, Coors, and
Great Western. The hard red wheat crop is exported to
Portland, Oregon, destined for Asian markets. The soft white
wheat is used for livestock feed, or milled in Utah and California
to make flour, cookies, and noodles.
ES: What is the growing season?
LS: Grain is planted in late March through April, with malt
barley planted first. The harvest is in August and September.
ES: Tell us about crop economics.
LS: Malt barley costs $5 per hundred weight to
produce. 90% of the crop is precontracted with Busch, Coors,
and Great Western. The crop is typically profitable. A
typical producer will have 600 to 1000 acres in malt barley, and use
it as a rotation crop with alfalfa and potatoes. All malt
barley is irrigated with yields of 100 to 140 bushels per
acre. Irrigation is via manually moved sprinkler lines, or
automatic center pivots using water pumped from the aquifer beneath
the Snake River valley.
Presently, soft white wheat is being grown at the government's
guaranteed loan rate of $2.48 per bushel. Though farmer's have
lost money growing soft white for the last three years, it is a part
of the crop rotation. Depressed prices have caused a decrease
in acreage. It costs Idaho farmers $2.75 to $3 per bushel to
produce. When the price drops below $2.48, the crop is turned
over to the government as collateral for the loan guarantee.
Soft white wheat is currently selling for $1.80.
Hard red spring wheat is selling for $2.70 for the 14 protein
grade. 13 protein has a 48 cent deduction, and 12 protein has
a 96 cent deduction in the price.
ES: How is the protein grade determined?
LS: A sample is taken for every three trucks from a grower,
and graded locally by a federally licensed inspection service.
Protein content is affected by fertilizer, temperature and
water. At the end of the growing season, the crop receives
less water to moisture stress it, and increase the protein
level. Less water lowers the yield, but raises the protein
level.
ES: What are the acreage yields?
LS: 95% of the soft white crop is irrigated, and yields are
80 to 120 bushels per acre. The 5% dry farm crop yield is 25
to 50 bushels per acre. Most dry farm acreage has gone into
the C.R.P.
ES: What is the C.R.P.?
LS: C.R.P is the commodity reserve program. The
government pays the farmers to put the land back to grass and leave
it idle for ten years. Farmers participating in the C.R.P. are
paid $45 per acre per year. Some 50,000 acres in Bonneville
County, Idaho, are in the C.R.P. This has really hurt the
small country elevators because it has reduced the size of the crop
for market. Some city folks who saw the C.R.P. coming, went
out and bought dry farms cheap, and now the C.R.P is making their
payments for them. The land is idle and their only expenses
are property taxes. Dry farms cover the hills of the Snake
River valley where it is too expensive to pump water or water is not
available.
ES: Tell us about the elevator business.
LS: We have four profit centers: 1) storage, 2)
handling, 3) trucking, and 4) seed cleaning.
Handling is where the elevator buys wheat from the grower, and
resells to exporters in Portland or to mills in Utah and
California. We buy soft white wheat for $1.80 a bushel and
sell it to the mills for $1.95 to $2.00. The 15 cent per
bushel markup is called our handle. When the government
receives a crop in the loan guarantee program at $2.48 per bushel,
the government pays us a handle of 10 cents per bushel and a storage
fee of 3 cents per month. About 20% to 25% of the soft white
wheat crop is being defaulted on now. We also have a fleet of
9 trucks to do custom hauling.
ES: What is the L.D.P.?
LS: L.D.P. is the Load Deficiency Payment program.
The government has a P.C.P., or Posted County Price which is updated
daily. A grower can elect to collect a loan deficiency payment
and keep ownership of his crop. It works in this manner.
The P.C.P. today for soft white wheat is $1.82, and the loan
guarantee price is $2.48. So, the farmer could walk into the
government office and collect 66 cents per bushel and retire the
guarantee. He would then either sell his crop to us, or put it
in storage and sell it later. Or, he could turn his crop over
to the government for the $2.48 per bushel guarantee price.
ES: How do you ship?
LS: Shipping is by Union Pacific Railroad to Portland, or
to mills in Utah and California. We order rail cars with a two
week lead time. Our elevators ship 100 rail cars per month,
with each car holding 3300 bushels. The cost of a rail car to
California is $2700, or about 80 cents per bushel. It costs
more to ship grain from Eastern Idaho to Portland than it does from
Nebraska to Portland because we are a captive market served only by
the Union Pacific Railroad.
ES: How is this year's crop?
LS: Weather has been warmer and dryer than normal, but most
of the acreage is irrigated anyway. This year we have a good
crop which matured early. The typical protein level is 9 1/2
to 10 1/2 for soft white, and 13 to 14 protein for hard red spring
wheat. Prices are depressed in the United States because the
supply is high, even though the world supply is down.
ES: Any advice for wheat speculators?
LS: Speculators need to know the market well enough to know
when wheat is under valued or over valued. They should never
buy a position they cannot afford to stay with and make margin calls
on. Usually one's judgment is right about a market being under
or over valued, and by riding out fluctuations the position will
return to being profitable. Do not try to get the top or the
bottom price. In our business, we hedge using options on
Chicago wheat, or hedge hard red spring wheat with MW options.
ES: Tell us what information source you use?
LS: We rely on market reports from Ag Resources in
Chicago. They issue an early morning report, a mid-day report
and an afternoon report. We have delayed DTN data terminals in
three locations. We also use DTN Internet (AgData.com) for
quotes and news.
ES: Can inquiries be made for more information?
LS: Yes, have them e-mail me at: mailto:KeeperOfWheat@prodigy.net |