October 2000Feature Tip:
Study Alerts on
Averages
by Howard
Arrington
A trader's arsenal of tools should include the ability to set
alerts on studies. This article illustrates how study
alerts can be set in Ensign Windows using the Alert object which is
found on the Draw Tool panel.
Display any chart and add any study. Then click
on the Alert button on the Draw Tool panel to add an alert to the
chart and display the parameter form for the alert. The alarm
clock button is the Alert object. Click it to set an
alert on a study.
The Alert object is incredibly flexible because of the
wide variety of things that can be tested. Basically an alert
compares two pieces of information and returns a Boolean True or
False result. The Alert occurs when the comparison is
True.
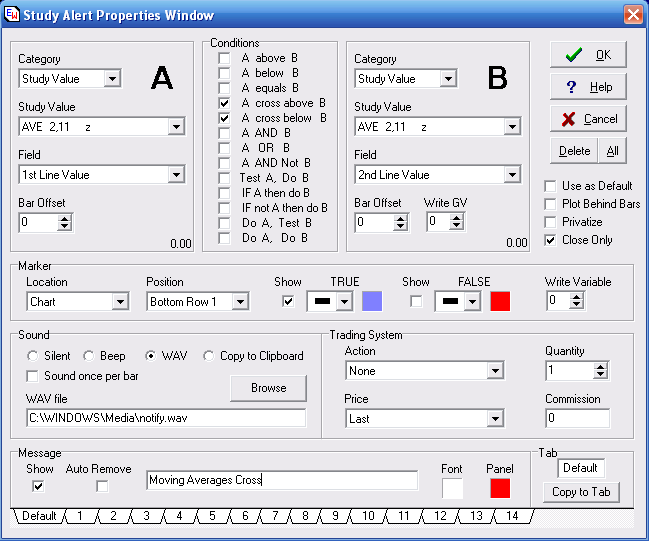
A simple and oft used alert would be when two moving
averages cross, as shown in the chart image above the Alert
parameter form. The 'A' panel on the left will obtain
information about the 1st moving average. The 'B' panel
on the right will obtain information about the 2nd moving
average. In this example, since we want to alert on the
crossing of two moving averages, we need to compare Study
Values. The other choices in the 1st drop down box are shown
below.
The 2nd drop down box in the 'A' panel selects which study
is used. Since a chart might have several studies, the desired
study is selected from the studies listed in the 2nd drop down
box. The studies on a chart at the time the alert object
is added will be shown in the list. Therefore, add a
study to a chart before adding the alert object. In our
example, the Ave 2,11 study is selected. Ave 2,11 is an
abbreviation for Average and the two line parameters are 2 and 11
period averages.
The contents of the 3rd drop down box will change according to
which study is selected in the 2nd drop down box. The
choices for a Simple Moving Average study are shown below.
The choices are fairly self explanatory. One can
select to work with the value of the 1st study line, the 2nd study
line, or the spread between these two study lines. A
Simple Moving Average study places two average lines on a chart each
controlled by a parameter for the period used in the average.
The choice 'Hi/Lo X 1st Line' will return a Boolean
True when the High of the bar crosses above or below the study line,
or when the Low of the bar crosses above or below the study
line. 'X' is an abbreviation for crossing, and checks a
bar and its neighbor to the left. For the High of a bar to
cross the study, the High of the bar would have to be on one side of
the study line, and the previous bar's High would have to be on the
other side of the study line. Thus the crossing occurs
only when the two bar Highs are on opposite sides of the study
line.
The '1st Line X 2nd Line' would return a Boolean True
when the two moving average lines cross going in either
direction. This choice could have been used as another way our
alert might have been implemented. 'Last X 1st Line"
returns Boolean True when the close of the bar crosses above or
below the 1st average line. '1st Line % of Scale'
returns a percentage between 0 and 100 of where the first average is
on the price scale.
The Bar Offset box is typically zero, but could be
changed to a negative number to reference a prior bar's prices or
study value. An offset of -1 would reference values from a bar
offset one bar to the left.
In summary, our 'A' value will be a Study Value
from the Ave 2,11 study, specifically the 1st Line's Value at the
bar being examined. The 'B' value is similar,
except the value will be from the 2nd Line's Value. Now that
the two study lines have been selected, how they are to be compared
is determined by the Conditions check boxes where one or more
conditions may apply. In this example, we want to be
alerted when the 1st Average Line crosses either above or below the
2nd Average Line. Thus both the 'A cross above B' and 'A cross
below B' condition boxes are checked.
The Marker Position is used to visually show where the
Alert object returned a Boolean True. A marker can be
placed in 24 different locations.
Uncheck the Show checkbox to not show any
marker. The first six choices place a marker near or on the
bar with the alert. The next eight choices place bullets
along four rows at either the top of the chart or at the bottom of
the chart. Our example shows a purple square placed below the
low of the bars where the averages crossed. This is the bar
that had the study alert, and it is nice to visually see where the
alert occurred. Tip: Use markers to visually verify that your
Alert object is finding the study conditions you are trying to
identify using the various choices in the drop down boxes and
Conditions panel.
An alert object can optionally color the bars where
the condition occurs instead of placing a marker. To color the
bar, select the chart bars selection in the marker drop down
list.
For the sake of illustration, let's modify the example
by unchecking the 'A cross below B' condition, and checking the 'A
below B' condition. Now, the bars where this
relationship is True are indicated by a sequence of markers as shown
in this image.
The condition of 'A below B' is a relationship,
instead of an event like a crossing of the two lines.
The reason I point this out is because users often want to combine
studies and have a compound alert phrased something like this:
"Alert when the moving average crosses down and the Stochastic
crosses down." While these study crossings can be
identified individually, it is unlikely that both studies would
cross on the same bar. An alert tool testing for two
simultaneous crossings would rarely return
True. Tip: Design one of the studies to be a
relationship (such as I just illustrated by marking all bars where
the 1st average is below the 2nd average), then have the other study
condition be the event of a crossing. This compound alert
would be phrased more correctly as: "Alert when the 1st
average is below the 2nd average and the Stochastic crosses
down." Now the alert condition is likely to exist.
Alerts using two studies may require nesting multiple
alert objects. One alert object might indicate the moving
average relationship. A second alert object would catch
the Stochastic crossing and have a 'A AND B' condition with the
result from the first Alert object.
If you want a message to appear when the alert occurs,
check the Show box in the Alert Message frame and type the text for
the message in the entry box. The two color boxes select
the color that will be used for the message font, and the color of
the message panel. Tip: Double click on a color
square to change the color using a Color Dialog form.
The Auto Remove check box controls whether the alert
message remains showing (unchecked) or is automatically removed when
the alert object returns a Boolean False. Be careful in
how this feature is used because multiple alerts, both trying to
remove the message panel, can interfere with each other and possibly
cause the chart to perpetual repaint itself. Tip: If multiple
alerts are on a chart, then it is best to have the Auto Remove box
unchecked on all of them.
When alerts trigger, an optional beep can be sounded
or a wav file can be played. You can record your own wav
files with spoken messages like "Averages crossed down."
A different wav file could be used for each alert object, or you can
play a standard wav file like C:\Windows\Chord.wav.
Select the 'Copy to Clipboard' choice to have the
Alert Message text copied to the clipboard. Use Speakonia
to announce your message.
Alert objects can also be triggers to buy and sell in
a trading system, but that will have to be the subject of a future
article. Enjoy the extreme power and great flexibility
Ensign Windows provides for setting alerts on studies.
The process of adding a study alert is really quite simple because
the drop down boxes show you the logical choices that are at your
disposal.
Feature Tip:
Zig Zag
Toolby Howard Arrington
Ensign Windows can draw a Zig Zag tool which shows the percent
retracement a subsequent wave is in comparison to a previous
wave. Here is an implementation I did of the Zig Zag tool
using ESPL.
Cut and paste this script, and then save it under a unique file
name such as FibLevel.
procedure FibLevel;
var
n,x,y:
integer;
x1,x2,x3,y1,y2,y3: integer;
p1,p2,p3:
real;
s: string;
begin
x1:=XtoIndex(Pt1X); x2:=XtoIndex(Pt2X); x3:=XtoIndex(Pt3X);
p1:=YtoPrice(Pt1Y);
if abs(High(x1)-p1)<abs(Low(x1)-p1)
then p1:=High(x1) else p1:=Low(x1);
y1:=PriceToY(p1);
x1:=IndexToX(x1); p2:=YtoPrice(Pt2Y);
if
abs(High(x2)-p2)<abs(Low(x2)-p2) then p2:=High(x2) else
p2:=Low(x2);
y2:=PriceToY(p2);
x2:=IndexToX(x2); p3:=YtoPrice(Pt3Y);
if
abs(High(x3)-p3)<abs(Low(x3)-p3) then p3:=High(x3) else
p3:=Low(x3);
y3:=PriceToY(p3);
x3:=IndexToX(x3);
setPen(clBlue,1);
if who=13 then
MovetoLineto(x1,y1,x2,y2);
if who>11 then
MovetoLineto(x2,y2,x3,y3);
MovetoLineto(x1,y1,x3,y3);
x:=(x3+x1) div 2-8;
y:=(y3+y1) div 2-6;
n:=round(100*(p3-p2) /
(p1-p2));
TextOut(x,y,inttostr(n));
end;
begin
if Who=11 then
FibLevel;
if Who=12 then FibLevel;
if Who=13
then FibLevel;
end;
This is how the tool works. We will use the first three
number buttons on the Draw Tools panel. The zig zag tool shows
three sides of a triangle, where two sides overlay two adjacent
trends and the 3rd side is like a bridge spanning the gap and has a
label showing the percent retracement the 2nd trend is in comparison
to the 1st trend.
The reason we use three number buttons is to select whether you
need to show one, two or three of the triangle sides. Fewer
than three lines would need to be shown when a subsequent triangle
is drawn connecting to an existing triangle. You still need to
identify the three points of the two waves, but you may not need to
remark these waves with lines when they are already shown.
To put the tool on the chart, click the #3 button on the Draw
Tools panel for 3 lines to be drawn. Move the cursor to the
start of the 1st wave (point A), click and hold down the mouse
button and move to the end of the 1st wave (point B). Release
the button and move to the end of the 2nd wave (point C) and
click. The three lines for the triangle are drawn and the
percentage relationship of the 2nd wave (B-C) to the 1st wave (A-C)
is shown as a number on the 3rd side (A-C) of the triangle. To
draw a triangle that shares the wave 2 (B-C) line already drawn,
click button #2 to draw 2 lines and repeat the construction process
beginning at the start of wave 2 (point B), retrace to point C,
release, and click on the 3rd wave's end (point D).
Two zig zag triangles are shown in this example. The first
A-B-C triangle shows wave B-C is a 157 percent larger than wave
A-B. The 2nd B-C-D triangle shows wave C-D is 135 percent
larger than wave B-C.
|