November 2001Study Tip:
Relative Strength Index Fundamental
Behavior
by Howard Arrington
The August
2001 issue of the Trading Tips newsletter introduced the
use of a theoretical Elliott wave formation as an aid in
understanding the fundamental behavior of a study. The
theoretical formation will be used this month for understanding the
Relative Strength Index introduced by J. Welles Wilder Jr. in his
book, "New Concepts in Technical Trading Systems".
Various characteristics can be found in the 7 bar Relative
Strength Index (RSI) study applied to this theoretical chart.
5 Wave Minor Trend Analysis: (blue 1-2-3-4-5 small
numbers)
1) The RSI crosses above 50 in minor wave 1, but
stays below 70.
2) Minor wave 2 may cause RSI to momentarily dip
back below 50.
3) Minor wave 3 takes RSI higher, often to around
80. In the real world %K will often reach 80 but rarely
90. Study tip: It is important to realize that it
is minor wave 3 that takes RSI to its highest high!
4) Minor wave 4 causes RSI to cross below 70 from
its lofty high, but remain above 50. This crossing is the
FALSE signal that traders fall for all too often. Going short
because of a turn at 3 is premature, and your stop just above
the top at 3 is taken out by the final thrust to the top at
minor wave 5. The psychological tendency is to ignore
the signal at 5 because of the loosing short attempted at
wave 3.
5) Minor wave 5 causes RSI to rise again, often
crossing back above 70, but the market lacks the duration in trend
to elevate RSI to a higher high. When RSI turns down and
crosses 70 the second time, this is the signal. Study
tip: Look for divergence, where the price action put in new
highs, but the study does not. Divergence between RSI
and price is a very strong indicator of a turning point.
Divergence is marked on the theoretical chart with short blue
lines.
3 Wave Minor Correction Analysis: (blue a-b-c
letters)
a) Minor wave a returns to the previous
support level of minor wave 4. But the drop of RSI is
huge, falling from a lofty high below 40. This rapid fall is
similar to the rapid rise that occurred in minor wave 1.
b) Minor wave b is a Fibonacci
retracement from a back towards 5.
The example has its price stopping at the top of wave
3. The effect on RSI is to rally back above 50,
possibly around 60.
c) Minor wave c takes RSI to new lows
around 30. The example shows a drop slightly below
30. Study tip: Divergence will not occur this
time. Therefore, the signal to go long is the first time
RSI crosses above 30. This is shown in the example at major
waves 2 and 4 (large red numbers) where the market
meets the long term support trend line shown in red.
Signal Summary:
The process starts over again as Relative Strength Index behaves
in a similar fashion for major waves 3 and 5 as it did for major
wave 1. The a-b-c correction of major wave 4 will be
similar to major wave 2. The ideal place to short is after
major wave 5 is in place, at what will be minor wave 2 of the first
trend leg of the new major correction.
Study tip: Relative Strength had three turns with
divergence at the end of major waves 1, 3 and 5 marked in
red. RSI turns at the end of the two reaction waves 2
and 4 did not have divergence. Look for this pattern to
help you identify the 5th major Elliott wave. The divergence
signal at the end of wave 5 is the ideal place to go short after a
major up-trend, or long after a major down-trend.
Bar Parameter:
Now that the fundamental behavior of Relative Strength Index is
understood as the Elliott waves develop in a market, the theoretical
chart will be used to observe the effect of different bar parameters
on the RSI. The bar parameter is used in the RSI formula to
average the Up and Down net totals. Changes in the bar
parameter affect the volatility of the study as illustrated
below. Study tip: Use a bar parameter that produces RSI
highs around 80 and lows around 20.
Research Tip:
Simulation Broker
by Howard Arrington
Last month's issue discussed the ability of the Ensign Windows
program to simulate a real-time data feed for a dummy symbol named
DEMO. This article discusses an Ensign Windows feature to
trade paper trades with a simulated order entry form. With a
DEMO chart displayed, click the right mouse button on the chart to
display a pop-up menu for the chart. Click on the menu
entry for Sim-Broker to show the simulated order entry form.
This simulation broker can also be used real-time to track trades
for any symbol. Sim-Broker tracks trades for the chart that
opened the Sim-Broker form.
 The form is divided into thirds. The left third is
where you enter your actions. The middle section shows a
summary of trades that have been placed. The right hand side
shows a transaction log. Click on the Printer button on the
main button bar to print the Summary information and the Transaction
Log.
The form is divided into thirds. The left third is
where you enter your actions. The middle section shows a
summary of trades that have been placed. The right hand side
shows a transaction log. Click on the Printer button on the
main button bar to print the Summary information and the Transaction
Log.
In the Order frame, select Buy or Sell, then select an order
Type. The Type can be a market order, limit price, stop or
stop and reverse. The trade quantity can be
entered. Simulated stock trades might use a quantity of
100-200 etc. For the DEMO symbol, use 1 or 2, or the quantity
you would usually trade for ES or NQ.
The next box is where Price is entered, followed by the Submit
button. For practice, select the Buy bullet, Market bullet,
with a quantity of 1. Then click Submit button. In so
doing a time stamped transaction is posted in the log. It will
read: Buy 1 @ Market. Shortly thereafter a fill is
received back with a time stamp and fill price.
This will initiate a position shown in the Summary frame.
The illustration shows Short with Qty of 4 and the fill price.
Further to the right the current price is shown. The next line
in the summary shows the profit/loss for this open position.
Under trades is shown the accumulation of all trades made using
Sim-Broker and the total profit loss for all trades.
Underneath the summary window is an edit box where the commission
for a round trip trade is entered. A typical commission is ten
dollars. Next to that is a box labeled Arrows. When
checked the fill prices for buys and sells will be marked on the
chart with arrows. Red arrows mark sells, and green arrows
mark the buys. The chart also shows the stops and limit
buys/sells with short horizontal lines.
A position is closed out by buying or selling the opposite side
of the position. After completing a round trip the Position
Summary will show Flat, and a horizontal break line will be posted
to the transaction log.
Pending limit orders and stops are shown in the pending frame
with a price by the checked box. To enter a limit buy, select
Buy and Limit. The Price window will show a static number that
was the current price when the order Type was changed to
Limit. You can use the spinner arrow that is part of the Price
box to increment or decrement the price. Click the Submit
button to post a message to the transaction log: Buy 1 @
......... The Pending frame will show a check mark by
the word Buy and then a price.
If the market goes lower and
touches the Limit Buy price, the check in the Buy checkbox will be
removed. A message will post in the transaction log:
Bought 1 @ and the fill price. Use the buy/sell Limit
order to place orders where you want to buy or sell.. Limit buys
will be below the current price. Limit sells will be above the
current price.
Likewise, stops can be used to go long or short. Select Buy
or Sell, and market type would be Stop. The stop also needs a
price. Buy stops are placed higher than current price and will
be shown on the chart with a short horizontal green line by the
price scale. The Buy Stop BS checkbox in the pending section
will become checked and show the stop price. Stops are easily
adjusted by submitting the stop order again using a new price.
The location of the alert line will be adjusted to the new stop
price. A later stop cancels the earlier stop.
The items
that show in the pending frame can be canceled by unchecking the
box. A buy stop is canceled by clicking the BS checkbox.
This removes the stop and the entry made to the transaction log will
show xx BS 1 @ ...... The xx in
the log entry means 'canceled'.
SAR is a stop and reverse. If long, enter a SAR at a
lower price to go short. If the SAR price is touched, then the
long position will be liquidated and reversed short the number in
the Quantity box. If position is long 5, and a SAR with
Quantity 1, it will then sell six, five to go flat and 1 to go
short. SAR can be put on either side of the current
price.
The Reset button will clear the summary and
transaction log. Another characteristic is that Sim-Broker is
doing a lot of math and tracking trades, and the form needs to be
open. The form can be minimized but not closed.
Sim-Broker will not work if closed. Multiple Sim-Broker
forms can be open simultaneously to track different symbols.
Hardware Tip:
Windows XP and the eMachines
T1110
by Howard Arrington
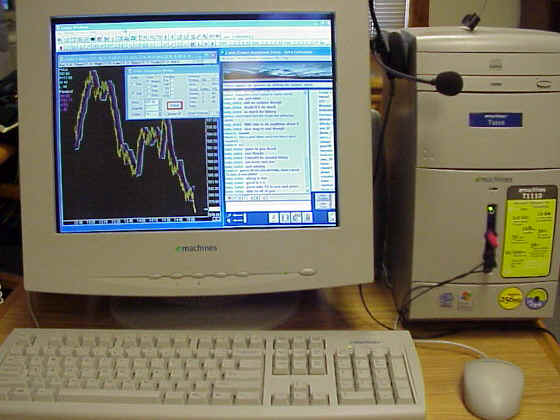
I bought a new computer with monitor on November 9th, 2001, from
Sam's Club for $599. Since I have been totally impressed with
both the computer and with Windows XP, I thought many of you would
be interested in my experience.
The eMachines T1110 computer has the following
specifications:
- 1 Gig Hz Intel Celeron processor
- 256 Meg of memory
- 30 Gig hard disk
- 12x CD-RW drive
- 3.25 diskette drive
- 56 K data/fax modem ITU V.92 ready
- 10/100 Mb Ethernet card
- Keyboard, mouse and small speakers
- 17 inch flat screen CRT monitor
- Windows XP Home edition pre-installed
- 3 PCI slots, 1 available
- 2 USB ports, 1 serial, 1 parallel, 1 game port, head phone,
speakers, and line-in jacks.
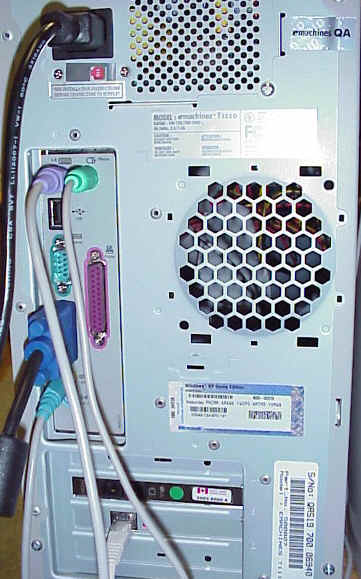
It took less than 15 minutes to unpack the computer, and plug in
the colored cables to the matching jacks on the back of the
computer. I also connected a cable from the router for the
office network to the Ethernet port. I then powered up
the computer and filled in the registration forms.
Windows XP detected my office network and Internet access through
the router, and self registered with Microsoft and with
eMachines. In a matter of minutes I was up and running, and
beginning my discovery of the new XP operating system from
Microsoft.
I used the preinstalled Internet Explorer 6 to go to the eSignal
web site at www.esignal.com, and download the eSignal 6.1 software
to obtain the Data Manager. I installed Ensign Windows,
entered my account and password in the Data Manager, and was up and
running on my eSignal account within a few minutes. I
have not encountered any problem in running the Data Manager and
Ensign Windows with the XP operating system.
The more I have used the computer and XP, the more I love
it. It is the fastest computer I have used and feels elegant
compared to the 300 MHz computer I have been using. I
really like the operating system and have yet to discover a problem
with it, or with the applications I use. Occasionally I
stumble on to a neat new feature of XP such as the Date/Time dialog
form includes the ability to synchronize the computer system clock
from the Internet. Another slick tool is the Task Manager
which is displayed by a right mouse click on the Start task
bar. The Task Manager includes a Processes tab which
shows the CPU utilization broken down by application. Ensign
Windows with Data Manager running is pretty steady at using 2% of
the CPU. The Page File usage is quite constant around
114 MB.
This inexpensive computer from eMachines is really a great
computer. I consider it a 'hot deal' at $599 because it
includes the 17 inch monitor, 256 Meg of memory, Ethernet port, a
CD-RW for burning CDs, a fast 1 Gig Hz processor, and Windows XP
preinstalled. I have not been disappointed in the
slightest. In fact, I went back to Sam's Club 12 days later to
buy another one and was disappointed that they were sold
out. |