January 2002Research Tip:
Neural Networks
by
Howard Arrington
In May of 1999, my good friend Larry Pesavento sent me his new
book, 'Profitable Patterns for Stock Trading'. While the
entire book is informative, it was the chapter on 'The Non Random
Nature of Chaos Theory' that caught my attention. In this
chapter, Larry gives a brief history of his introduction to neural
networks in 1992, and his subsequent consuming research with neural
networks. The neural network forecasts that Larry has shared
with me over the past few years have been impressive, even down
right profound.
Neural networks have been used as an expert system in stock
market forecasting with astonishingly accurate results. We all
want to have tomorrow's Wall Street Journal delivered today, and
perhaps neural networks are the closest thing yet to having a
crystal ball so we can see tomorrow today. A Neural Network is
a mathematical system loosely modeled on the human brain. A
neural network attempts to simulate market behavior using
sophisticated software which has multiple layers of simple
processing elements called neurons. Each neuron or node is
linked to other neurons with varying coefficients of connectivity
that represent the strengths of these connections. Learning
(training the network) is accomplished by adjusting these strengths
to cause the overall network to output useful results.
Since neural networks have a strong similarity to the human brain
a great deal of the terminology is borrowed from neuroscience.
Artificial neurons are the basic unit of neural networks.
Although biological neurons are more complex than the artificial
neurons, the artificial neurons simulate the four basic functions of
natural neurons of accepting input, analysis, feedback, and
generating output for other neurons. The basics of an
artificial neuron are shown in this figure.
In the network each neuron receives various inputs, each
multiplied by a connection weight. In the simplest case, these
products are summed and processed through a transfer function to
generate an output. The neurons are interconnected and
processing may pass through multiple layers of neurons before
arriving at the final output. The minimal network structure
would have an input layer, a hidden center layer, and an output
layer.
Neural networks can be designed in many ways, but all are
constructed from the basic building blocks. You should start
with a commercial software package for creating neural networks
because the mathematics involved are very complex. Then your
challenge as a researcher will be to go through a period of trial
and error in the design decisions before coming up with useful
results. The design issues are complex and useful results may
elude anything but a serious effort and commitment.
These design issues must be given thoughtful consideration when
creating a neural network:
- Selecting the number of hidden layers and arranging neurons in
the various layers.
- Deciding the type of connections among the neurons.
- Determining the strength of the connections within the
network.
- Selecting what data to use as input and what will be the
output.
Issues 1) and 2) are configuration parameters that are set in the
neural net software program. Issue 3) is accomplished by
allowing the network to learn the appropriate connection weight
values by using a training data set. The majority of the work
involved in working with neural nets will be in the preparation and
maintenance of training data sets. The biggest challenge is
issue 4), the selection of inputs and outputs for the neural
network. Obviously some inputs will be more worthwhile than
other inputs. What is not obvious is knowing what those inputs
should be.
The process of designing a neural network is an iterative
process. Just like the brain which learns from experience,
neural networks learn by changing its connection weights until it
learns the solution to a problem. The weight-value for every
neuron to neuron connection is stored or memorized so the network
can process a new set of inputs to generate a predictive
output. The system needs to be retrained on a frequent basis
so that connection weights can be adjusted to incorporate new
knowledge.
Neural nets have the ability to generalize. The training
data sets teach the neural net to recognize more than just what has
been seen in the past. A neural net can discover
characteristics about the training data sets that may elude our
perception. While market movement may at first glance appear
to be random, neural nets demonstrate that markets are not totally
random. There are waves, vibrations and patterns that
repeat. The value of the neural net is its ability to
digest massive amounts of data and perform hundreds of thousands of
calculations to discover the market's intrinsic characteristics, and
generate useful predictions.
Do I have the 'crystal ball' yet? No. I feel I am
like Galileo who put two glass pieces on the ends of a tube and
discovered with his crude telescope he could now see something he
could not discern before. Was Galileo's first telescope
the 'crystal ball'? No. Through time and
effort, telescopes evolved into better instruments with greater
power, with an occasional radical new design. Neural nets are
a work in progress as new inputs are considered and more research is
performed. The end objective is greater accuracy and
correlation between tomorrow's forecast and reality. Some days
the forecasts are very accurate and give the advantage of knowing in
advance where and when the markets will turn. On other days,
however, the forecasts are not worth the paper they are printed
on. The goal of every neural net researcher is improved
accuracy and a reduction in the frequency of occurrence of
worthless or misleading forecasts.
I won't tell you the specifics of where I am at in my personal
evolution with neural nets. I will pass on a few tips to help
you get started if you are inclined to seriously investigate neural
nets.
-
Plan on spending a couple thousand dollars to buy a commercial
neural set software package. You must realize that the
neural net software is just a tool, it is not the end
solution. You still have to design the neural network and
then train it.
-
Use a very fast computer with a big hard disk. Some of
the neural net models may number crunch for hours.
-
Either program yourself or hire a good programmer to design
tools that aid in the preparation of training data sets.
Most neural net program accept ASCII files or Excel files for the
input, and generate the same files as the output. As
stated before, the majority of the work will be in the preparation
and maintenance of training data sets. Make the data
preparation program flexible because you will want to evolve and
test new ideas.
-
Plan on an initial phase of excitement and enthusiasm, followed
by several years of dedicated research as you search for a 'holier
grail'.
-
Data that might be considered as Input in your neural
net design include (but not limited to):
- Astronomical
relationships, periods of rotation and orbit
- Time of day, day
of week, season, days to expiration
- Patterns and Cycles
-
Numerology, including Gann and Fibonacci numbers and ratios
-
Daily statistics such as Open, High, Low, Close, Net, Volume and
Open-Interest
- Up ticks, Down ticks, and tick volumes
-
Time and Price data points: intra-day data would be a
candidate for intra-day forecasts, and daily data for daily
forecasts.
- Various Studies (I have personally
discounted these because they are a 2nd generation digestion of
the original Time and Price data).
The chart
Overlay feature in Ensign Windows can be used to display a neural
net forecast with a host chart. The forecast is an
Ensign data file created from the output of a neural net. The
forecast extends into the future when plotted on the host
chart. The host chart updates in real-time and plots in proper
synchronization with the forecast so both are seen simultaneously as
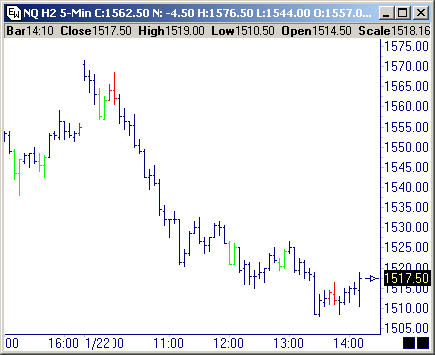
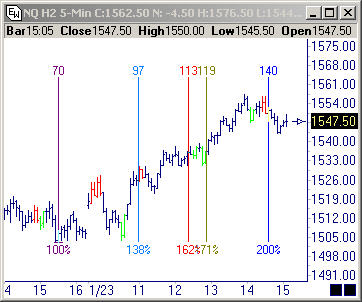
shown in these examples. The first chart shows a forecast for
daily Live Cattle prices for last December. The forecast was
made at the end of November for the entire month of December.
The next chart shows an intra-day forecast for January
22nd, 2002. The forecast was made in advance for the entire
day.
Appreciation is expressed to Dr. John Arrington for
permission to publish the two chart examples which are the result of
his research over several years with neural networks. His
research is focused on the live cattle markets for his personal
trading. He does not have anything to discuss, share, or
sell. So please respect his privacy.
Study Tip:
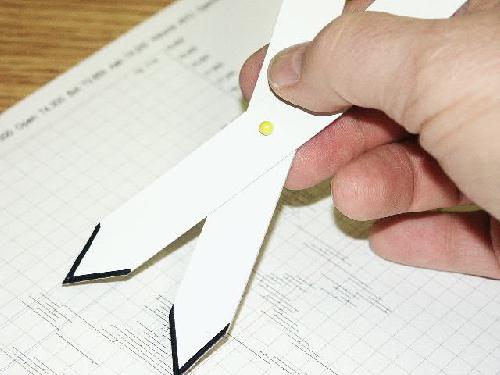
Fibonacci Dividers
Fibonacci dividers are two rods joined with a pivot like a pair
of scissors and pointed on both ends. The pivot point is
located at 61.8% of the length of the rods. A pair of
Fibonacci dividers can be made from a 10 inch dinner size plastic
plate and 2 map pins.
- Cut two strips from the plate, 7 inches long, and 3/4 inches
wide.
- Trim the 4 ends to have V shaped points.
Both strips are to be identical in length, width and shape.
- Measure a strip's length, and mark the pivot point at
0.618 times the length.
- Use a map pin as the pivot point axle. Insert the pin at
the pivot point to pin both strips together.
- Snip off the pin point after it has been inserted at the point
point. Leave 1/8th inch length.
- Cover the exposed end of the snipped pin axle with the ball
removed from another map pin. You will have a ball on each
end of the pin axle.

Use the Fibonacci dividers to measure 61.8% relationships:
- Measure the distance on a chart with the Wide end.
- Turn the dividers over without changing the opening angle of
the divider legs.
- Use the Narrow end to measure the 61.8% distance.
Use the Fibonacci divider to measure 161.8% relationships:
- Measure the distance on a chart with the Narrow end.
- Turn the dividers over without changing the opening angle of
the divider legs.
- Use the Wide end to measure the 161.8% distance.
Fibonacci dividers are a convenient tool for measuring and
projecting Fibonacci relationships. The dividers can be used
in the vertical direction on a chart to measure price relationships,
or in the horizontal direction to measure time relationships.
Article:
Google Switches Beds!
by Pam
Data feed is down! NO NOT AGAIN!! The stupid charts
won’t come up and I’m sitting here cursing the day I even thought
about trading. "Jim sweety, what’s the price on NQ right
now?!" Jim is my backup data feed, as I desperately await his
typing on my screen. NQ @ 1433 and going down fast!
"Thanks Jimmy, you’re a savior!" Great! So after all my
preparation the night before I’m doing nothing. "Hello, can
you tell me why your charts are showing delays? Also, they
lack very important studies. Any chance of having them in
there soon?!" My ears don’t like the response and it’s the
same thing day in day out. How do they expect people to make a
living with this kindergarten stuff they have on there?!! Now
I’m looking for an excuse to vent out, and I start rethinking what
I’m doing. I rely on pattern recognition but I can’t survive
without other elements being present on my charts. Price
doesn’t travel horizontally nor vertically. I know what I want
and need. The 2 packages I’m using don’t give me that and I’m
frustrated with spending countless hours trying to manually plot all
these lines and studies and align them perfectly on my chart.
No more of this. THEY HAVE TO GO! The hunt has just
begun.
I decided to evaluate 3 packages, and "Ensign Windows" was one of
them. Before even going through each of them, I listed my
criteria:
- Efficiency - work smart in less time
- Reliable customer support and responsiveness
- Reliable data feed
- Reasonably priced
- Studies in price and time
- Flexibility in controlling parameters of studies
- Programming language for custom development
- Back testing
Let me give this thing a shot, who knows. "Hey Google, we’ve got
Stochastic, MACD and a plethora of studies, etc.". Yeah, yeah,
yeah. Can it wash my dishes too?! Being a skeptic about
the business paradigm of vendors in this industry, you can’t blame
me for my attitude.
New data feed; new package; tons of icons, menus, studies.
Geez! I refuse to go through each of the features.
This is insane! I decide to let the package come to me instead
of the other way around. Darn! It’s 7 p.m. and I need to
finish preparing for tomorrow. I pull out my calculator to
punch in numbers. Hey wait a minute, let me try something
else.
Google: "Howard, does Ensign calculate pivots
automatically?!".
ES: "Sure does Google! Go to
Draw tools/support and resistance. With mouse mark high, low
and close and it should give you the levels for tomorrow
instantly!"
Great, let me double check and calculate the numbers
myself. Yep, they’re accurate. I just saved myself 15-20
minutes of work every night!
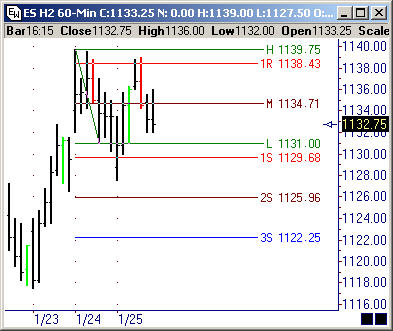
Pivot calculations with
support/resistance draw tool
"So what are we doing today?" Ensign is running a training
session on ESPL. It’s the programming language used to create
custom indicators and control virtually almost every aspect of the
package. Ensign has a built in chat room where they conduct
training sessions and provide support for their product. I.e.
nice way for me to shower them with my questions and get responses
on the fly instead of this "email-answer me whenever you have time"
business. Howard rants on the microphone, while the transcript
rolls on the chat window. The transcript is saved on their
website in case someone wants to refer to it at a later date.
Oh my, what’s that on the chart?? Is anybody trading
today?! It’s an official holiday (MLK) and some bars are
showing on my charts that are just irritating.
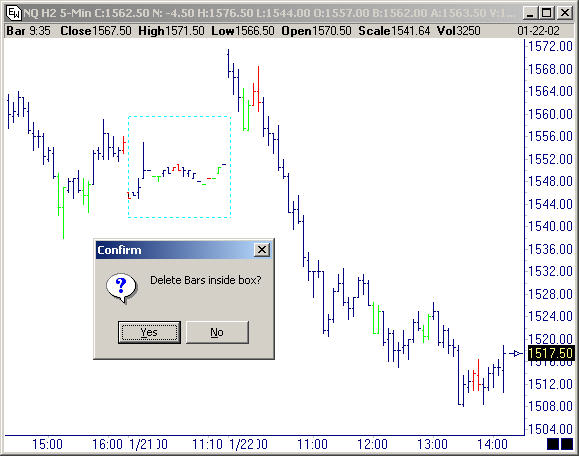
Extra bars pre-deletion
Google: "Is there a way to delete those bars?"
ES:
"Did you check the delete area feature?"
Google: "No. Instead
of going through each feature, I decided to let the package come to
me".
ES: "You decided what??"
Google: "Never
mind." (he probably thinks I’m crazy or something)
ES:
"Click on Delete Area icon, highlight area to be deleted with
mouse and click Yes."
Bars gone! Same can be applied to bad ticks and bad
data. I can also delete part of a bar if it was a bad tick and
leave the rest intact. Now that’s neat. How many other
packages do that?!
Extra bars gone
post-deletion
So it’s been couple of weeks and I got my charts setup.
Howard pays his, almost daily, visit to the built in chat
rooms. I like those visits because I always have questions
about Ensign, and it’s a good chance to know more about the package
from the source. Also, the room has great professional traders
with enough knowledge about the package and are willing to answer
questions and share their trading techniques.
Google: "Hi Howard, there’re certain things missing from
Ensign!"
ES: "Like what?"
Google: "Well, what
good are the circles without labels?! Also, no time
fib!! How come I can’t create my own custom fib levels?!....."
(Now he’s thinking, this girl flipped out for good!)
Hey listen, I’m a perfectionist, and from what I’ve seen so far,
Ensign is many steps ahead of most of the packages out there.
So don’t blame me for asking for those extras! Knowing how
vendors work, those features will probably be on the bottom of his
list, that’s if they ever get done.
Three days pass by and it’s the weekend, and the ambitious
Traders Anonymous are at work as usual. Howard pops in.
(Did I tell you he’s also in the room on weekends and
holidays?!)
ES: "Folks, I got a surprise for you!... I
just added labels to circles. I’ve redesigned the fib tool to
have user-defined custom levels. Same design will be applied
to fib retracement tool. I’ve also reworked the time
fib….."
Google: "Are you kidding me?!" (Thought I was the
only workaholic around, but it seems Howard/Ensign are offering a
good competition in that department J
)
One of my favorite tools – fib
retracement with fans and user-defined fib levels
Time fib draw tool with user-defined
fib levels.
Have to admit, I didn’t expect that. But that’s the kind of
response Ensign is providing its customers. I feel like a
customer for the first time in a long while when it comes to this
industry. Between training they provide, their chat room,
Howard’s regular visits to Trader’s room, transcripts/tutorials on
their website, and email, Ensign is reaching out to its customers to
ensure they know enough about the product to succeed.
Now if I can get ESPL straightened out and write some decent
scripts. Oh, I need to explore with back-testing features
too….I’m not done with my research….. how about making custom
studies to calculate probable CIT…. want to change look and
feel…colors….lines to be dots not dashes…. Oh my, many things to do,
I better stop now….later with other thoughts…
Google |