April 2002Systems:
www.dacharts.com
by
Howard Arrington
One of the patrons of the NQ/ES Pals chat room is David
Shedd. He maintains a very informative web site where NQ and
ES traders from the chat room post chart images showing their
analysis. The web site address is http://www.dacharts.com/
You definitely need to go to this web site and read the educational
material about trading systems, Pyrapoint, and view the library of
chart examples posted by various contributors. Each day
a new chart folder is added where charts are posted during the day
to show live market analysis by various traders.
Here is one example of the type of analysis posted by
traders to the www.dacharts.com website.
Analysis:
Pyrapoint & Full Moon
by Howard Arrington
Past issues of the Trading Tips newsletter has extolled the
benefits of using the Pyrapoint tool, and of watching moon
phases. Here is a current chart showing profound
correlation of the Pyrapoint End-of-Square and the Full Moon
occurring at the same time, and how very depressed cattle futures
have responded.
For more information on the Pyrapoint tool read
the January
2001 issue of the Trading Tips newsletter.
For more
information on Moon Phases read the February
2001 issue of the Trading Tips newsletter.
Software:
Super Ensign Windows
by Kimball Hansen and Howard Arrington
Several changes and additions were made recently to the already
popular Ensign Windows charting program. They make Ensign
Windows unequaled in the flexibility and power of its studies and
draw tools.
1) Tabs: Each Study and Draw Tool now has 14 unique
settings that can be saved. The properties window for each
study and tool displays several tabs at the bottom of the
screen. The 'Default' tab contains the default
settings which is used when a new study or tool is added to a
chart. Whenever you select the 'Use as Default'
checkbox (when viewing any tab), the settings will be copied to
the 'Default' tab. This enables you to either
change the default settings directly, or update the defaults from
another tab (by checking the 'Use as Default' checkbox). Click
on one of the tabs to view or change the settings. This
allows you to have many unique settings for each study and tool.

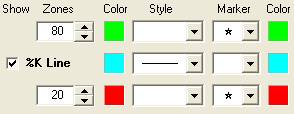
2) Markers and Line Styles: Each Study and Draw Tool
can now be drawn with markers. There are also several new line
styles and line thicknesses. The markers include arrows,
circles, letters, numbers, prices, dates, bar counters, percentages,
bar highlighting, histograms, and many shapes. The markers can
be placed on the left and right sides of each Draw Tool line.
The markers can also be drawn on Study lines. The following
example shows how to draw a Stochastic study line with different
colors and 'Star' markers when the study gets above 80 or
below 20.
Other examples: An RSI study can highlight bars on a chart (with
color) when the RSI value gets below 20. Or, the spread
between two Moving Average lines can be drawn with various histogram
styles and colors. In summary, the added flexibility of
markers can really enhance all the studies and draw tools.
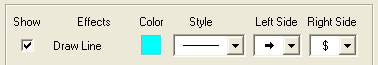
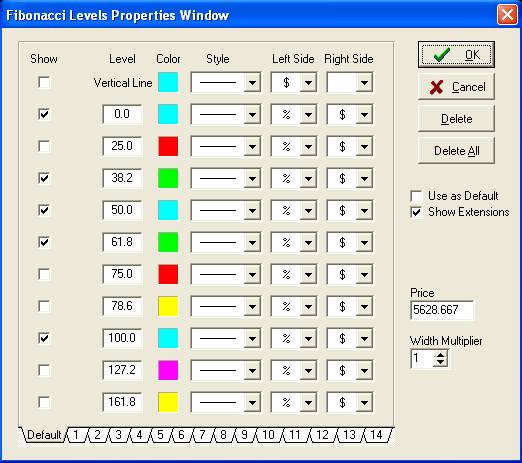
3) Draw Tools: The properties window for Draw Tools
now has up to 11 rows of line parameters that can be
specified. Each row has a check box to show a line (uncheck
the box to hide a line). Each line can have unique percentage
levels, colors, styles, and markers (for both left and right sides
of the line). The following example shows a Fibonacci Levels
properties window. The tool will draw Fibonacci lines with
various percentage levels and colors. A marker is placed on
the left side of each Fibonacci line to print the '%' percent level
of the line. A marker is placed on the right side of each
Fibonacci line to print the '$' price level of each line.
One customer summarized his opinion in saying, "The tools for
visualization are shaping up to be light years ahead of anything
else out there." -N. Ali 04-25-2002
4) All the Moving Averages have been combined into 1 Study
in Ensign Windows. The calculation formula can be specified as
either Simple, Exponential, Weighted, or Smoothed. This gives
you 4 different types of moving average studies.
5) The MACD Exponential and MACD Simple studies
have been combined into 1 study. The calculation formulas can
be specified as either Simple, Exponential, Weighted, or Smoothed
averages so you have 4 different types of MACD studies.
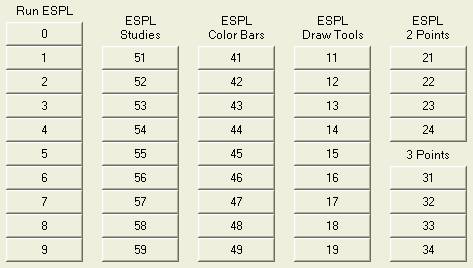
6) All ESPL RUN buttons have been moved
to a central window. Click the RUN button on
the toolbar to open the window. There are no longer ESPL run
buttons at the bottom of the Studies list, ColorBars list, and
DrawTools panel. The captions for all these RUN buttons can be
changed by using the btnESPL0 -
btnESPL59 commands. For example: btnESPL51.caption:='MyStudy'; will
change the caption on button 51.
7) Ensign Windows performs powerful Market
Statistics analysis. This feature was the subject of the March
2002 Trading Tips newsletter.
8) All menus and button bars have been
redesigned to be docking toolbars. Buttons used infrequently
can be removed from the toolbars. This image shows the main
menu, workspace tabs, two docked toolbars and two floating
toolbars.
9) Other New features: Donchian
Channels, Price Magnet, Line Draw Mode, Square of Nine Levels,
Schiff Lines, Play Back feature, large file sizes up to 65534 bars,
and the transfer of draw lines to other time frames.
ESPL:
ESPL – for the Power
Programmer
by Paul Levin
Part I
This article is a review of some of the features and the power of
ESPL; the programming language provided with Ensign Windows. I
should mention that I have been programming for over 20 years, and
as such, this article is written by a programmer, for
programmers. Before I chase all the non-programmers away, let
me point out that, like all aspects of Ensign Windows, ESPL can be
used in many ways. It is very possible to write useful tools
in just a few simple lines of ESPL. So if you want to learn just
enough ESPL, to be able to whip off a simple 5 line indicator, or a
new way to color bars, ESPL can do it. On the other hand, if
you want to write a series of complex computations, requiring
several charts and timeframes, remembering prior computations and
generating multiple forms of output; well then, ESPL can do that
too.
Before getting started, I’ll mention that my outline for this
article could result in a small novel, rather than an article.
Therefore the plan is to break it into pieces, with subsequent parts
in future issues of this newsletter.
Operating Environment
Before writing the first line of ESPL, there are a few concepts
that are foundational in ESPL, that should be understood. The
first of these is that Ensign uses, at most, one ESPL file (aka
script or program) at a time. However, that script may contain
the code for any number of studies. In addition, the physical
file that is specified to the ESPL compiler may reference other
files, whose content are read by the compiler. This allows
your script to be extremely large, while still allowing the
programmer to segment and manage the code.
The ESPL Editor window, in addition to providing a text editor,
controls when the code is running (the Run button) and when it is
not (the editing check box). Clicking in the editor window stops all
ESPL code from running. Clicking the Run button will compile
the code, and if error free, allow the code to run. Notice
that ESPL is compiled, enabling your code to run much faster than
otherwise. It is important to note that the compiler only
allows for backward referencing. That is, any reference to a
variable or procedure, must occur after that variable or procedure
has already been declared.
There are several features in Ensign Windows that can make use of
ESPL code. These include:
|
|
An ESPL study is applied to a chart, in the same way that
regular studies are applied to charts. Multiple instances of
an ESPL study may be applied to one chart. Similarly,
instances of an ESPL study may be applied to multiple
charts. How the ESPL code determines which instance of
the study is being run, is discussed later in this
article. |
|
|
Just like studies, an Ensign drawing tool can be
implemented in ESPL. Multiple instances of the drawing
tool may be applied to one or more charts. |
|
|
Similar to studies and drawing tools, color bar studies can
be implemented in ESPL. Several instances of a color bar
study may be applied to multiple charts; where, only one
instance is applied to each chart. |
|
|
Ensign has a timer that can invoke an ESPL script on a
regular time interval; configurable in second
increments. |
|
|
The Ensign scheduler can invoke an ESPL script at a
configured time of day. The scheduler is unique in it’s
use of ESPL, in that, it is the only place that the ESPL code
file may be specified. In all other cases, the currently
loaded ESPL file (the last file opened in the ESPL editor) is
used. |
|
|
These buttons appear in the ESPL editor, and in the menu
bar of the main window, after the editor has been
opened. Clicking any of these buttons, 0 (also called
Run) through 9, can invoke an ESPL script. |
|
|
The invocation of ESPL can be accomplished using hot keys
Alt-0 through Alt-9. And, the invocation of ESPL can be
tied to the Shift function keys, F2 through
F12. |
Before I proceed, let me give you a moment to ponder the massive
flexibility of this list.
ESPL uses a built-in global variable, called ESPL
(called Who in old versions of Ensign Windows)
, to determine which of these invocation methods has
been used. Each study, button, function key, etc. will invoke
the ESPL code, with a different ESPL value.
(Refer to the ESPL documentation of the ESPL variable for
specific values).
Some of the invocation methods, such as studies, may invoke the
ESPL script for every tick or at the close of each bar. A
check box in the study’s properties window selects this
setting. Of course, studies that are called on every tick,
will require more processing power, than studies that are called
only at the end of the bar. To be accurate, the study is
actually called on the first tick of the new bar, rather than the
last tick of the finished bar.
When ESPL code for a study, drawing tool or color bar study is
called (invoked), there are some other global variables that define
the context in which the code runs. An Ensign chart exists in
a window, and so, the global variable Window
identifies the window (and thus the chart) that owns the study; for
which the script is being called. Chart information, by
default, is obtained for the current window. It is
possible for the code to change the Window variable,
and thus obtain information about other windows/charts. There
is also the concept of the current study; which is the study
for which the code was invoked. Methods that access study
information, take a parameter that specifies the study. The
current study is referred to by the value zero.
The global built-in variables BarBegin and
BarEnd are basically indices into the array of bars
displayed in a chart. BarBegin is the left most
(or oldest) bar, and BarEnd is the right most (or
newest) bar. When Ensign needs the ESPL study to process all
of the bars in the chart, then these variables are not equal, and
encompass the range of bars in the chart. Subsequent calls to
the ESPL script, made for new bars in the chart, are called with
these two variables being equal, and identifying the newest
bar. Thus the code can identify an initialization invocation
by comparing these values for non-equality.
For reasons of both size and subject matter, this is a good place
to stop. Next time, we will look at some of the key aspects of a
programming language, that are incorporated in
ESPL. |