May 2002Trading Tip:
Chart Overlays
by
Howard Arrington
We all seek a leading indicator that gives advance notice of what
the market is going to do next. I have been watching the
interaction of JNPR (Juniper Networks) and the June Nasdaq futures
contact. At several key turning points in NQ M2, I see that
JNPR is already leading the way, giving advance notice of what the
NQ M2 market will do next. Permit me to share with you a
three day sequence in comparing both charts using 5-minute intra-day
bars.
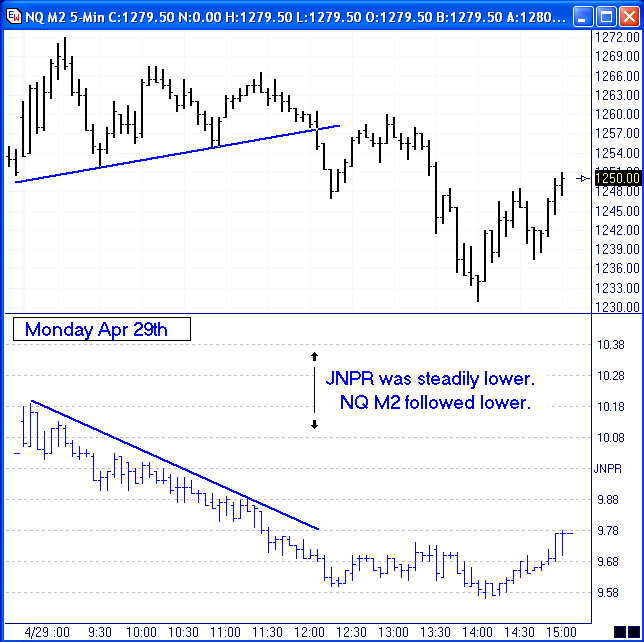
On Monday, NQ M2 formed a wedge from the open until
12:00 (noon Central time). The question in the minds of NQ
traders was whether the breakout from the wedge would be up or
down. The JNPR chart was steadily lower all morning serving as
an advance indicator that NQ would be going DOWN and not up.
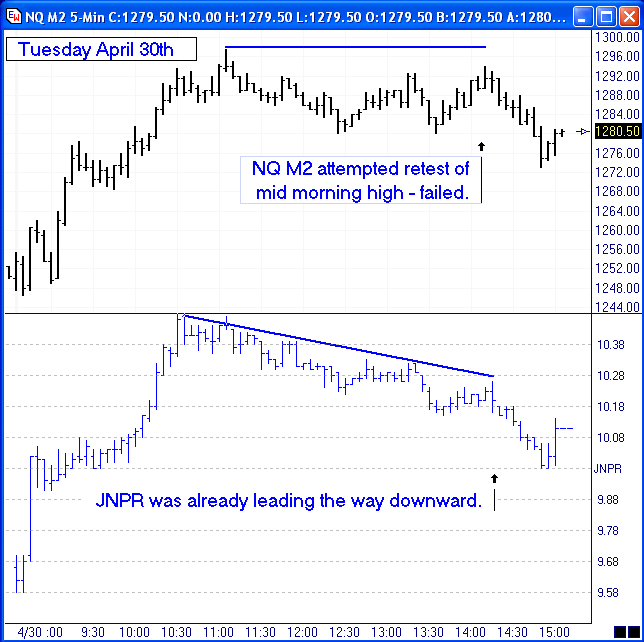
On Tuesday, JNPR and NQ M2 both rallied until
10:30. NQ M2 put in a new high at 11:05, but JNPR did
not. This is a first BIG clue that the 11:05 top in NQ M2 was
going to be the daily high. At 14:10, NQ M2 was pushing higher
for a possible retest of the 11:05 high, but JNPR was definitely in
a downtrend. JNPR's 14:10 rally was nowhere near its
mid-morning high. Again, JNPR served as an advance indicator
that the NQ M2 retest of the high would fail, and NQ M2 would go
lower.
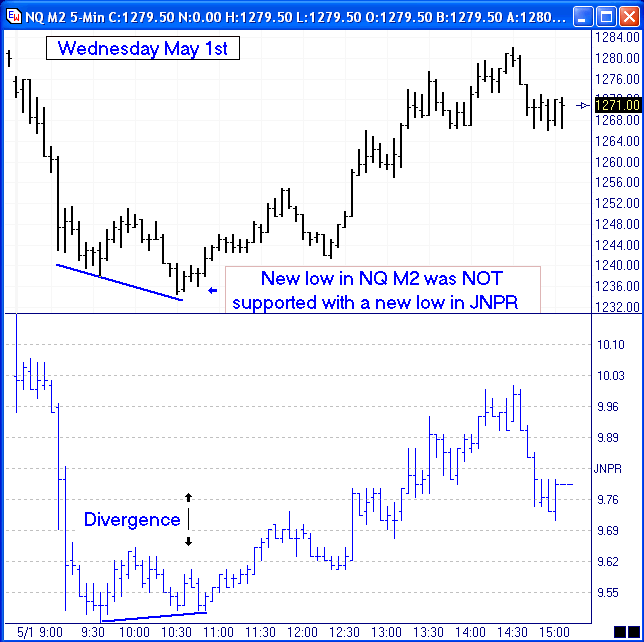
Wednesday opened with a sharp sell-off in both JNPR
and NQ M2. They both put in lows at 9:35. NQ M2 put in a
new lower low at 10:30, but JNPR found support and did not put in a
new low. Again, JNPR gave advance notice that the market would
not continue lower. See the divergence that is marked on this
chart. From the 10:30 lows, both JNPR and NQ M2 experienced
significant rallies.
Have I found the crystal ball for NQ in the form of
JNPR? I doubt it. Useful correlation found (with
the benefit of hindsight) on three charts is not statistically
sound. However, the trading tip being taught is that an
individual stock may respond a bit quicker than a composite
index. JNPR is a heavily traded Nasdaq stock, and I am seeing
useful correlation where the e-mini Nasdaq future follows the
direction set by JNPR. At least in the three day sequence
documented in this article, JNPR was a worthy leading
indicator. There was significant divergence at three key
turning points in comparing JNPR behavior at these tops and bottoms
with the NQ M2 behavior. NQ M2 followed the JNPR lead either
higher or lower. When NQ M2 tried to go higher but JNPR was
going lower, NQ M2 turned around and went lower. When NQ M2
tried to go lower, but JNPR would not follow lower, NQ M2 turned
around and went higher. This is just the type of leading
divergence indicator sought after by analysts who use studies to
show confirmation and divergence.
Trading Tip:
Square of Nine Levels
by Howard Arrington
Appreciation is expressed to Greg Corbin for sharing this amazing
chart of July Wheat showing the Gann Square of Nine levels marked on
the chart. Note how frequently the market turns on one of the
45 degree intervals on the Gann Square of Nine.
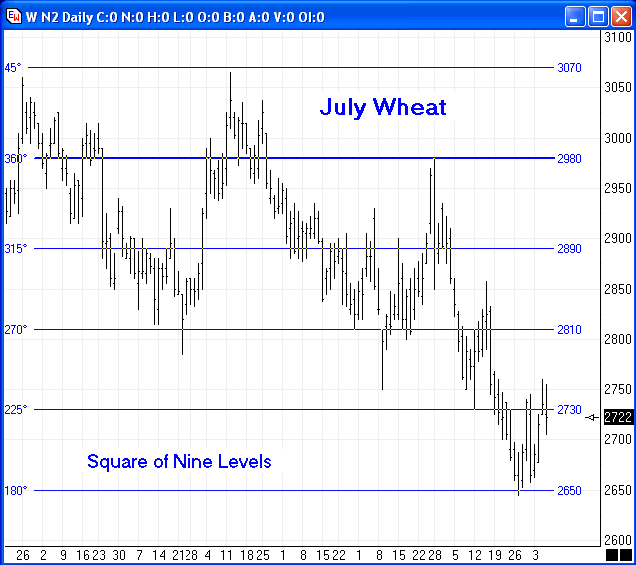
The Square of Nine is a spiral of numbers on a grid,
starting with 1 in the center. The spiral gets its name from
the first inner square counting to nine. The left side
horizontal is known as the zero or 360 degree line. 90
degrees would be the prices that align vertically above the center
point, and is measured clockwise from the zero line.
Example beginning of the Square of Nine number spiral:
31 32 33
34 35 36 37
30 13 14 15
16 17 38
29 12 3
4 5 18 39
28 11
2 1 6 19 40
27
10 9 8 7 20
41
26 25 24 23 22 21
42
49 48 47 46 45 44
43
The number series continues to spiral outward to ever
increasing values. Eventually the values shown on the
chart are discovered on the Gann Square of Nine. On the Square
of Nine the number 2650 is on the 180 degree ray, and the number
2980 is on the 360 degree ray. The Gann Square of Nine
is a tool available in the Ensign Windows program.
Analysis:
Vista Charts and Historical
Analysis
by Dom Concilio
Part I
Does history repeat itself? Is there something to MOON
PHASES, TRIPLE WITCHING, LUNAR and SOLAR ECLIPSES? What about
FOMC DAYS, or WEEKS, or any other possible repetitive/cyclical
possibilities you can think of? What of PATTERN RECOGNITION,
and PROGRAM TRADING? Is there really anything to all this
stuff, or is just another bunch of hocus pocus?
Did you know that, since 1982 (the first year the SP FUTURES
started trading), FULL MOON TRADING DAYS in AUG close NEGATIVE 76%
of the time? Here are the only times in SP history that the
FULL MOON was on a Thursday in August.
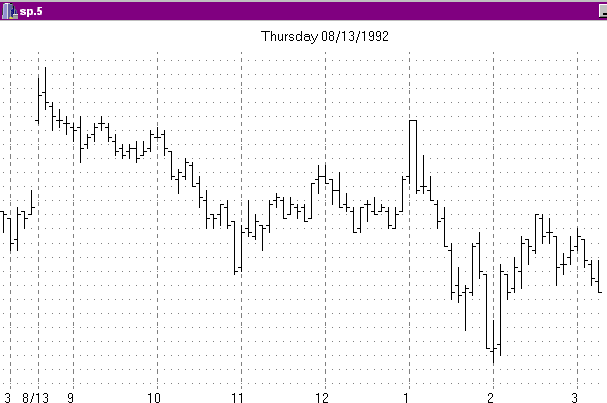
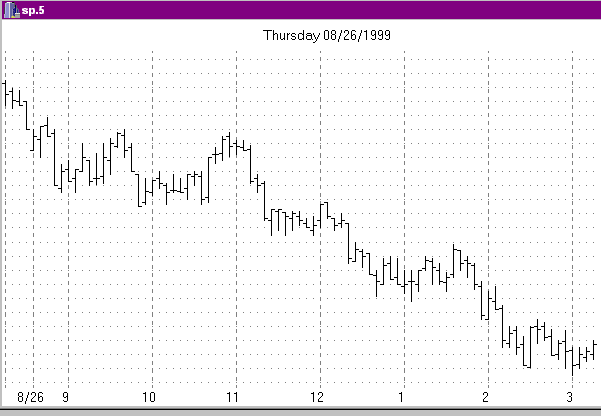
Tip: This year the FULL MOON is on Thursday, August 22,
2002.
I've invested in the markets for some years now. At one
point I was getting a little bored. So a friend of mine
suggested that I check out a website http://www.programtrading.com/.
It was back in 1997 and I read all this stuff about when the CRASH
was coming. The site wrote about some Monday in October, and
that it was the Anniversary of the Crash of 29, that it was
some color and some moon thing and some other stuff. I said to
myself, "sure". October came and guess what? Yes, we did
have a market drop of over 7%. And Yes, it was on the date
that was mentioned on the website. So I decided to check out
one of these Program Trading Seminars.
This is the 5 minute chart of the "CRASH OF '97"
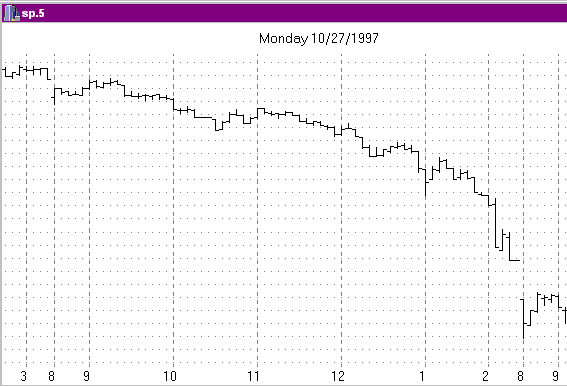
This seminar changed my whole view on things. I proceeded
to gather all types of historical data, and created a database of
many things. There was a problem however, in that I couldn't
get the historical charts to look at all like what I am used to
looking at every day. I spent some time developing this
database, but yet could not apply it in a simple way. The
simplest way for me would be to be able to print out historical
charts that would match my existing real-time software. I've used
Ensign Software since 1997, and I have found that there is no better
software in the world for me. It's so easy to use and so easy
to SEE.
So I set out to create a charting software for historical data
that could do what I wanted it to do. A software to give me
the flexibility for viewing and printing that I needed. AND
one that had no limitations with regard to sizes of data
files. Now with this software I can print out any charts I
want and it is if I just printed it from today's trading day.
I found this to be Very Powerful. It's like
having duplicates of the same photo.
Is it real, or is it just a random walk?
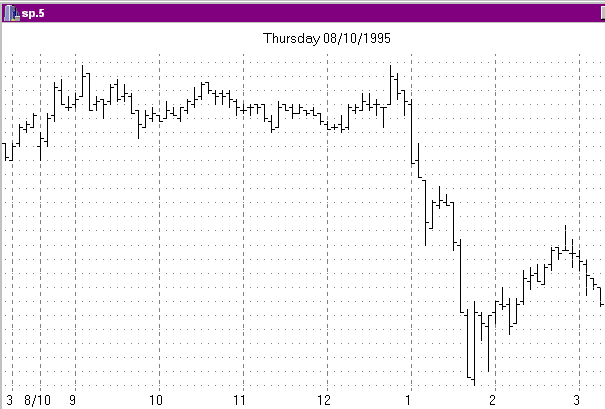
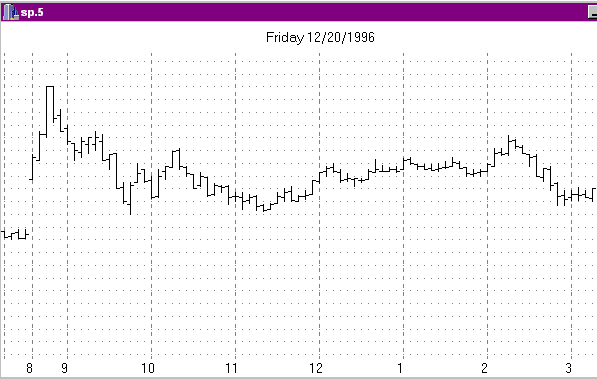
Expiration Fridays in December close POSITIVE 80% since
1982. That's 16 of 20. Knowing this, wouldn't you want
to have a printed chart of every one of them, in your preferred time
frame, and it looks just like what you are looking at real time?
These are 2 of the December Expiration Fridays. GDP report was
also released these days. Yes, it was the only times that the
GDP was released on EXP Friday in December.
Tip: I believe that this year, Expiration Friday is
12/20/2002. And I believe that GDP will be released the same
day.
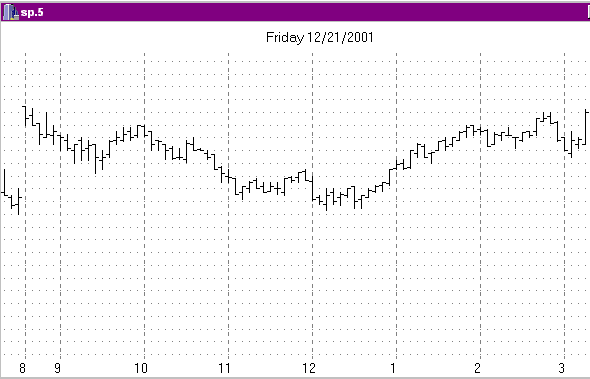
How about this? When Expiration Friday in December is on
the 15th of the month, (3 times in SP history), there were 3 of the
4 times that a December Expiration Friday closed NEGATIVE. The
HIGH of the morning was 8:35 am. Wouldn't it be nice to have
those charts printed out and at your fingertips?
Historical research. It's a lot of fun.
I was on a plane one day with a friend of mine. We were on
our way to another one of these seminars. While we were
waiting, I started doing some research on that particular trading
day. I said, "Hey Tom, look at this. Almost every one of
these days sell off after the first hour of trading. Let's
call this in". So I called the broker from the plane, and
instructed him to sell some S&Ps at around 9:30, and put a stop
above the high of the day. Then I told him to tighten stops at
lunch, and look for the lows of the day to be in the last
hour. He complied. When we got off the plane and got all
our things together we gave a call to see how we made out.
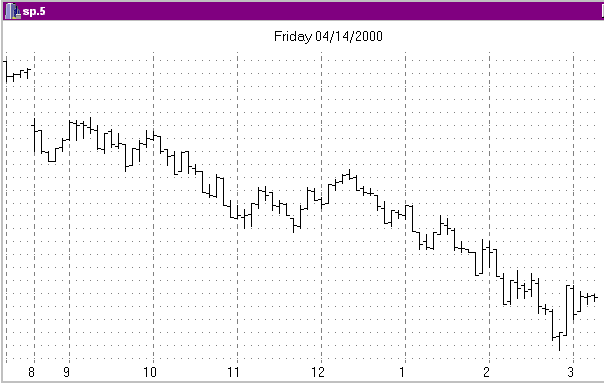
That day was April 14,2000. The high of the day was 9:15
and the low of the day was 2:50. The S&P dropped 88
points that day. Needless to say, we were quite
pleased.
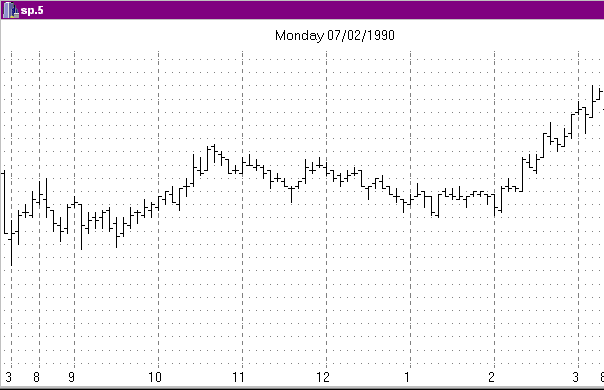
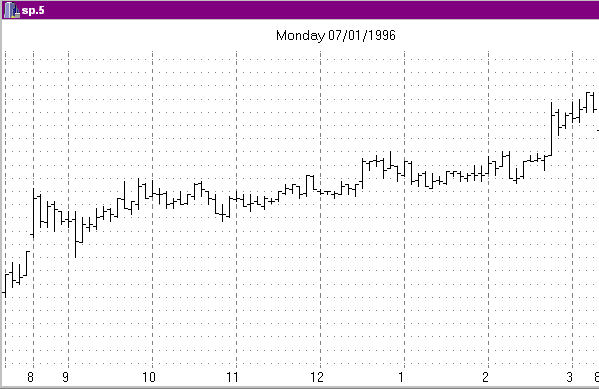
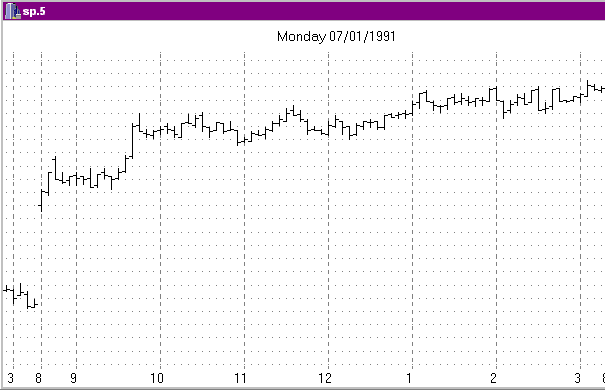
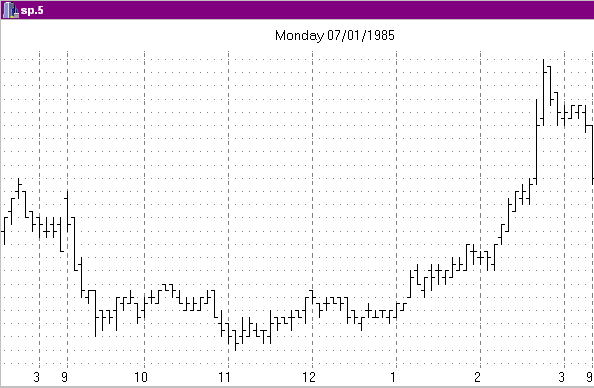
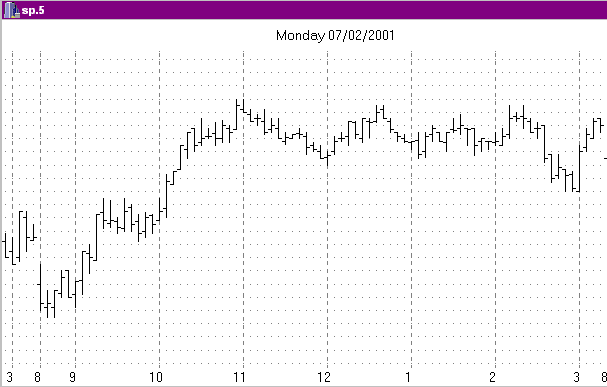
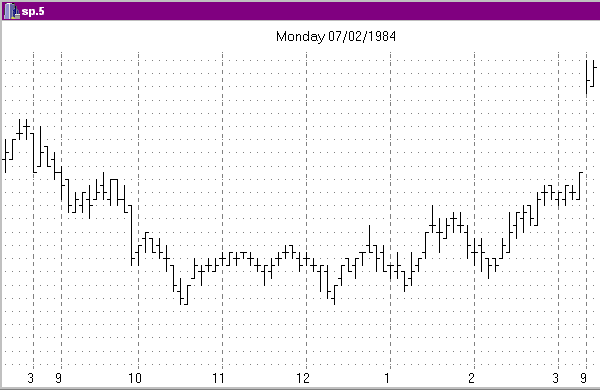
Here's an interesting one. When the First
Trading Day of JULY is on a MONDAY, the SP'S have closed POSITIVE
100% of the time. These are just a few of those
days.
(Editor's note: Dom's article is lengthy, but very
intriguing. The balance of his article will be published
in the June 2002 issue of the Trading Tips newsletter.)
ESPL:
ESPL – for the Power
Programmer
by Paul Levin
Part II
In the first part of this series, I covered some basic concepts
about ESPL. This segment will examine ESPL for essential
characteristics of a programming language.
Over the past few years, I have looked at, and used a small hand
full of programmable charting packages. As a programmer of
many years, having worked with over a dozen programming languages,
the first thing I look for in these charting packages, are the
essentials that are key to any programming language. I am
happy to say that ESPL has the largest number of these
essentials.
Before other experienced software developers hand me my head, let
me point out that there are several different types of programming
languages. Two classifications that come to mind, are what I
call, "linear programming" and "rules based programming". In
linear programming, the program is executed in the order that the
code is written, unless modified by flow control instructions.
Conventional linear languages are C++ and Java. Rules based
languages can execute in what might appear to be random order, based
on criteria being met, regarding the data being operated on.
Examples of such languages are Amzi Prolog and XSLT. ESPL is a
linear programming language.
Like Prego, "It’s in There"
Standard Programming Language Features
The first thing presented in many manuals and books for the
typical linear programming language, is a description of the data
types and variables the language supports. Most coding in ESPL
can be done with the data types: integer, real,
and Boolean. In addition, ESPL provides
support for arrays of these basic types and character strings.
There are also several "special" data types, that are unique to
ESPL, such as TDateTime, TListBox, TStringList, TFont, TForm
and TScreen. These special data types are used by
specific built-in methods. As expected, your code does not
access their contents directly, but rather obtains ones of these
data types from a built-in method and then passes it back to other
built-in methods.
The next thing typically discussed in programming language
manuals is operators and expressions. In this area, ESPL has
the full complement of numeric, Boolean, and string operators.
The numeric operators include binary operators such as shift left
(SHL), shift right (SHR), binary OR
(OR), binary AND (AND), and exclusive-or
(XOR). All of the typical Boolean operators are
provided. For strings, the ‘+’ operator provides
concatenation.
Flow control statements are next on my hit list. These
include the typical goto, if-then-else,
while, repeat-until, and
for. ESPL has all of these statements. I
include in the flow control group, what I call convenience
statements. These would be break,
continue, and return.
Unfortunately ESPL does not have these statements. Flow
control also includes the ability to call subroutines and
functions. ESPL uses the name procedure for
subroutines, and function for functions. A built-in
variable called Result must be assigned the return
value of a function, and return is made at the end of the function’s
code. The lack of a return statement leads to the use of a
label, placed at the end of the function, with goto
statements in the function’s code. I guess I should have
mentioned that ESPL has the label data type. Labels must be
explicitly declared. Note that a declared label that is not
used, both as being placed in the code (i.e. label: ),
and being referenced (in a goto statement) will result in a
compilation error.
The mention of procedures and functions requires a brief
discussion of parameter passing. Conventionally there are
three ways to pass parameters to a method. (The word method
is used here as a generic term for procedures and functions.)
They are referred to as: pass by value, pass by reference and pass
by name. Pass by name is relatively rare, and does not appear in
ESPL, so we’ll skip that one. In the case of pass by value the
method obtains the value of the parameter, and can not effect any
variable in the calling method. With pass by reference, the
called method has access to the value of the parameter, and any
change made to the parameter will change the associated variable in
the calling method. The primary use for pass by reference, is
to allow the called method to provide multiple outputs to the
caller. This is in contrast to the single output provided by
the returned value of a function. Happily, ESPL provides for
both pass by value and pass by reference.
A programming language is of no use, without input and output
(usually referred to as I/O). Here is where ESPL truly
excels. Most of ESPL’s I/O deals with interfacing to Ensign
charts, which I will discuss in a moment. In addition, ESPL
has a full complement of other I/O methods. These include:
- the reading and writing of files;
- reading keyboard input;
- writing to the text output window of the ESPL editor;
- writing to a text box window (in the main Ensign window);
- writing to the Windows clipboard;
- reading and writing to DDE (Dynamic Data Exchange);
- playing sounds (.wav files);
- invoking Windows/Dos commands;
- reading http sites from the internet;
- reading and writing ftp sites from the internet; and
- sending e-mail.
You must admit, that such a list of built-in I/O capabilities is
very impressive for any programming language.
An additional capability, which could loosely be classified as
I/O, is the ability for ESPL to invoke any code made available
through a DLL (dynamic link library). With this capability, an ESPL
script can do just about anything.
The last conventional programming language feature, that I want
to mention about ESPL, is the Include statement.
This statement allows the programmer to segment the code being
written, into logical pieces, each in its own file. Those
files can then be "included" into a master file, which is the file
opened in the ESPL editor. When the program being written is
large, the capability to segment pieces of it, is essential.
Though this statement has nothing to do with execution, it is (in my
humble opinion) a critical feature in any programming
language. I am happy to say, that, with regards to ESPL,
it’s in there.
Charting Package Programming Language Features
A general programming language is all well and good, but we are
interested in a charting package programming language. Here is
where ESPL will blow you away. To state our desire in one
sentence: anything I can see on the screen (charts, quote page,
etc.) and anything I can do with the mouse and/or keyboard (apply
studies, etc.) should be accessible to the ESPL program. I
would say that ESPL meets this goal about 90%. Far greater
than any other charting package programming language that I have
seen thus far.
Starting with a basic chart, ESPL has full access to the values
of the price bars. This includes the obvious High, Low, Open,
Close, Volume, and Timestamp. ESPL can read and write these values
for any bar on the chart. In addition, ESPL can add and delete
bars from the chart, thus a program can construct it’s own chart
full of bars.
Any study, bar coloring, or draw tool that can be added to a
chart, from the menus, can be added and removed, from ESPL. In
addition, any value, for any line drawn by the studies, can be
read. All properties (with a few minor exceptions) including
colors, line style, markers, and marker colors can be read and
changed from ESPL.
The contents of quote page cells can be read from ESPL. I
have had some problems writing quote page cells, though the
documentation says it is possible.
ESPL has built-in methods for activating many of the pull down
menu selections. If that isn’t enough, ESPL can "force"
keystrokes into the input stream, as if they had been typed at the
keyboard. An ESPL script can access the list of open windows,
it can open new windows, it can close any window, and obtain
information about any window – such as its contents, if it
minimized, etc.
I hope you are beginning to see that the power of ESPL is
awesome; and the possibilities for what it can do, are endless.
For reasons of both size and subject matter, this is a good place
to stop. Next time, we will look at the issue of data storage
for your programs, and then several new features that I would like
to see in future releases of ESPL. |