September 2002Article:
The 'Trading' / 'Forecasting'
Cap
by Lambert-Gann Educators
Inc.
(This article is applicable to forecasting discussed in this and
prior issues of the Trading Tips newsletter. This article is
reprinted by permission of Lambert-Gann Educators,
Inc.
The forecaster predicts what a market
should do. Once traders have used proven
forecasting techniques to compile a forecast, the forecast dates
and/or prices are noted on the traders' chart and in their trading
diary. The forecast is but one component of their written
trading plan. With the forecast duly noted, their role as a
forecaster has ended.
The trader uses all of his or her trading skills to trade (or
not trade) what the market does, not what the forecast said
it should do. As soon as people consider risking money in
the market, to trade a forecast or a proven market set-up, they are
now wearing their 'Trading' cap. From this point onward it is
their skills as a trader that are utilized.
The Advantages of Forecasting
The reason many people spend time learning how to forecast is
that a well-prepared forecast, traded correctly, can enhance trading
profits dramatically. In addition, a forecast helps give
traders confidence in staying with a longer-term trade.
Professional traders use forecasting to allow them to enter a
market closer to a confirmed bottom or top. They also lock in
more profits by using tighter stops as a forecasted turning point
approaches. If the market does not change direction as
forecasted, it is of no concern to them as they are in the market
and the market is moving in the direction of their trade. They
keep using their trading skills to stay in the trade according to
their written trading plan.
Professional traders also use forecasts to prepare for a possible
trading campaign - that is to trade a possible large market move
once a major market top or bottom has been confirmed. Both
Gann and Livermore regularly reminded traders that the big money was
made trading the big moves and forecasting skills can make a
significant difference in trading such moves.
The Pitfalls of Forecasting
Some traders fall in love with their forecasts. They enter
a trade, but fail to replace their 'Forecasting' cap with their
'Trading' cap. They are then fully exposed to some of the
pitfalls of forecasting.
Forecasting has the potential to reduce a trader's profitability
for some inadequately prepared people. This is usually due to
one or more of the following reasons:
- They were not a consistently profitable trader before starting
to apply forecasts to their trading. As a consequence, they
attempt to trade a forecast and not the market reality.
- Even when the forecast appears to be working, they take the
confirmed trade according to their rules, however they then assume
that the market must keep trending in its new direction. If
it does not, a profitable trade soon becomes a losing trade.
- Once they have a forecast in their minds, they find it
difficult to ignore the forecast and to trade the market in the
opposite direction to the forecast when it is clear that the
forecast did not work. For example, if a forecast suggests
that a major top should occur in late October in a given year and
the market is still rising strongly in November, a professional
trader would know that there is only one direction in which to
trade, and that is with the trend - upwards. Many traders
will suffer a huge opportunity cost when they allow a forecast to
scare them into inaction when the forecast fails.
The biggest enemy of traders who forecast is their ego.
Successful forecasts work wonders in feeding one's ego, but it is
trading skills that translate a successful forecast into trading
profits.
Conversely, a failed forecast is just that. It is not a
negative reflection on the worth or skills of the forecaster.
No forecaster is 100 per cent correct.
A forecast that does not result in a market reversal, does not
necessarily mean a trading loss. In fact, if a trader is
wearing his or her 'Trading' cap, it is more than likely to end up
being a very profitable trade as the market continues in the
direction of the trade.
By all means become a good forecaster. Just ensure that you
always remember that it is your skills as a trader that will make
you the enhanced trading profits. A good forecaster who cannot
trade, however, is likely to end up on an ego trip to the poor
house. That is why we teach you how to forecast - but we
always place greater emphasis on teaching you the skills required to
trade.
Article:
Ephemeris Forecasting
by Stephen Pavel
I'm complimented that you would consider including in a
newsletter, but if better content comes along, I wouldn't be
disappointed not to see it. In case you would include the
charts, I've attached the gifs, fairly crude compared
to Crystal Ball charts. Was just expressing an opinion,
and demonstrating a familiar Pesavento theme with respect to
Jim Twentyman: "Defy human nature ... do the work
yourself". However, I recognize many are far more
capable at certain activities, and am most willing to work with
those ... given the opportunity, I'd jump.
This note is to show interest, support, encouragement, applause,
and willingness to do whatever it takes to help, or at least see the
continuation of the Crystal Ball charts. Thanks for the chat
room training session. I was impressed by the Larry Pesavento
article ... reinforced his "Artificial Intelligence" book, re:
Tomahawk. With the comments regarding timing, I am keeping an
eye on an ephemeris, and reread his "Planetary Harmonics".
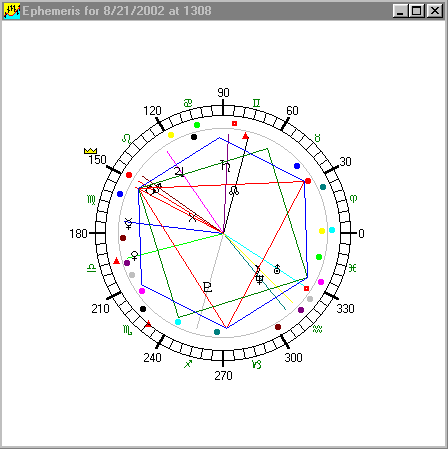
After I read the article I started to work with some
projections based on the moon, Mercury, Venus, Jupiter, etc... Yes,
a long road there, but sometimes
very interesting timing,
especially with inversions or slight adjustment forward and/or
backward a few, or quite a few bars. My charts don't look
close to the Crystal Ball charts ... perhaps more cycles of
different length and amplitude all being summarized by one line.
Not much adjustment in this one, except the blue line
needed to come back a few bars, just using the inverted. Yes,
different times of the day might be fit by different curves.
You might guess that Larry hardly ever mentions any of
the solar system in his chat room; there are many that just cannot
handle such references, and I
have the impression he wouldn't
want to waste his time with the responses (especially if it meant
typing). He also doesn't mention the neural net timing very
often, most likely for the same reasons.
I was very, very impressed by the results generated from your
efforts. I would like to see such effort continue, doing
whatever I could to help, participate or otherwise contribute.
Hey, granted it might take me a bit of time to catch up. There
are two traders I would like to emulate and Larry Pesavento is one
of them. In that light, the timing is number one, price
pattern is number two; working well enough with the patterns, but
missing the key of timing.
I appreciate the open format of http://www.dacharts.com/, and
there are no doubt many benefits to that system. Admittedly, I
hadn't looked at the site very often before the chat room comments,
but I caught up tonight ... really incredible advancement. If
it is necessary to reduce flak from the uninterested, closed minded,
or plain antagonistic folk, ... reduce distribution to those that
are interested and supportive. I would like get my name near
to the top on a distribution list, password area, whatever would
work, to keep the information flowing. Naturally, I am very
impressed with Ensign Software's Crystal Ball work.
Great software, super support, and brilliant insights.
Thanks again. Best regards, Stephen Pavel
Article:
Crystal Ball Forecasts
by Howard Arrington
OK, I plead guilty to tantalizing patrons of the chat rooms by
posting examples of Ensign's research efforts to the http://www.dacharts.com/ web
site. The examples have shown the next day's probable price
action prior to it happening. Thus the forecast has
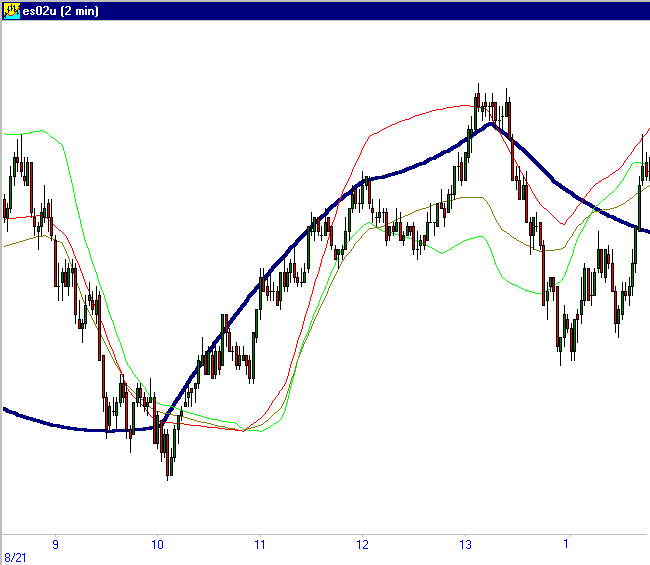
taken on the name of Crystal Ball. Here is an example forecast
for ES U2 that was generated and posted to http://www.dacharts.com/ on
Saturday, August 17th, showing the probable price action for Monday,
August 19th.
It was with great interest, anticipation, and pleasure
to watch ES U2 (2-minute chart) behave as predicted. The
actual market is shown with the forecast in this illustration
captured during the day on Monday, August 19th. The time
stamps on the chart are for the Mountain time zone.
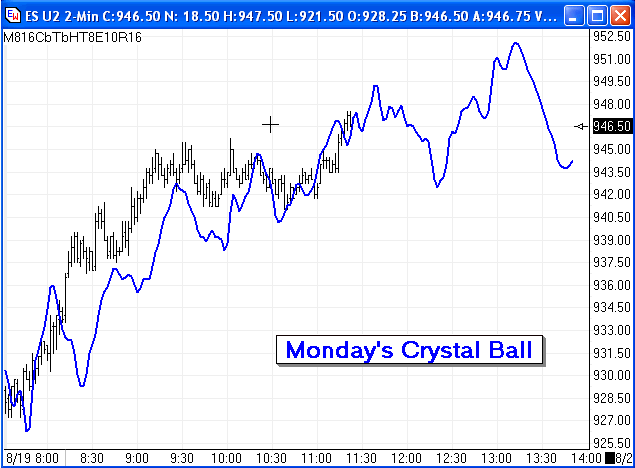
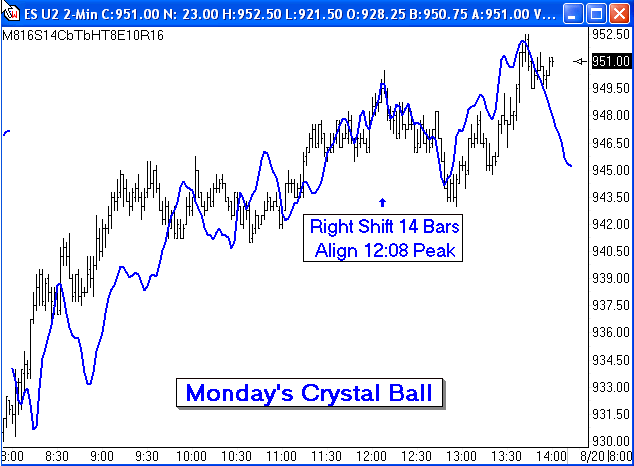
Market action in the afternoon experienced a slight
rightward phase shift departure from the forecast. The
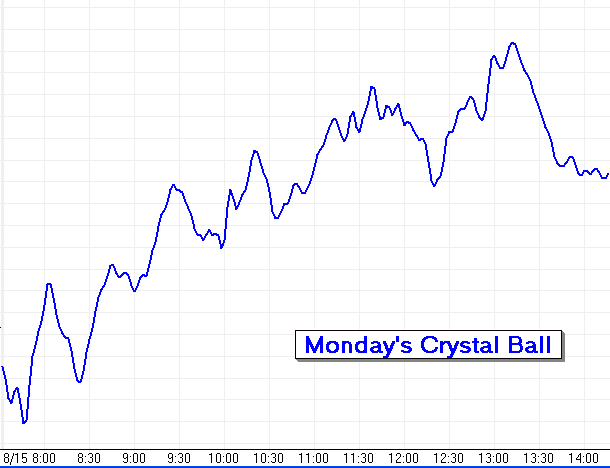
forecast was adjusted by realigning the forecast 11:40 peak with the
actual peak at 12:08. The balance of the afternoon with the
Crystal Ball forecast realigned to the right is shown in the next
chart. Quite amazing isn't it, that a forecast could be
calculated in advance and actually come to pass with any degree of
resemblance? Such is the on-going Crystal Ball research
effort at Ensign Software.
The advantages and pitfalls of working with forecasts
is discussed in the lead article. We must all remember that a
forecast is dealing in probabilities, not certainties. The
primary characteristic the Crystal Ball is showing is the TIMING of
a turn, where statistically it is likely to occur. The
predicted turn may come early, on-time, late or not at all.
The example shows the predicted 11:40 peak came late at 12:08.
In spite of that, the subsequent duration of the down trend that
followed and subsequent up trend into the close were still relative
to the actual turn at 12:08.
Crystal Ball is a research effort still in
development. Sample charts have occasionally been posted
to the http://www.dacharts.com/ web
site. New ideas are being tested. Current results
are very promising, however.
Trading Tip:
Using Candlestick Formations
by James Baumann
There are two similarities between Ensign Software and the stock
market. The first is that you can spend a lifetime attempting
to learn all there is to know about how they work. The second
is that each present great opportunities to prosper. One of
the oldest methodologies used to analyze price movements in any
market is candlestick patterns. Price action when plotted on a
chart using candlesticks to represent the highs and lows of prices
traded and the main body of the trades that take place, reveal
patterns that repeat themselves. These repeating candlestick
patterns present excellent trade opportunities. Many traders
are aware of candlestick formations, however they are not inclined
to invest the time and study necessary to memorize all the nuances
that are reflected in each different pattern. In September
2001 I wrote an article about the Triangle formations. The
Triangle pattern is a single trend indicating formation that signals
the trader as to which side of the market to trade. Since the
introduction of the Triangle program these formations have been very
effective as a trend indicator. If anyone would like to review
the various triangle buy and short signals that where generated by
the program, I have listed the signals from the daily chart of the
QQQ Nasdaq tracking stock at the end of this article.
In the past year I spent time learning and reviewing Candlestick
pattern formations to see if they would be of any benefit to my
trading. I found that there are library shelves filled with
lists of various types of bars and formations in Candlestick
terminology.
Some are very good while most are worthless for trading.
The few formations that I found useful in live trading turned out to
be extremely useful. They are of course not fool proof,
however, what I found was that they are easy to read and
interpret. The entry and stop loss points are very clear
cut. The only problem for a trader is finding these
formations. This is where the power of Ensign reigns
supreme. In order for a series of price bars to qualify as a
particular candlestick pattern the bars must meet a series of
criteria that uses multiple combinations of highs verses lows, opens
verses closes, bullish bars verses bearish bars, all intertwined
together. As everyone is aware it would take you forever to
review every chart checking to see if this high is above that high
and if this bar was bullish or bearish. Trust me you cannot
remember all the combinations of rules let alone find the time or
have the inclination to search for such situations on charts.
Attempting to search for these formations on an inter day basis has
until now been a pipe dream. Here is where the power of Ensign
comes to the rescue. I have expanded the capabilities of my
Triangle program to include a scan tool for bearish and bullish
candlestick patterns.
I have narrowed the list of candlestick formations down to only
include the most reliable formations. Using my program these
formations can be located in a matter of seconds depending on your
computer. Ensign code allows the user to scan for these
formations in any time frame. I have integrated these
formations into my trading system in a very simple and easy to
follow method. First, I run my Triangle trend indicator on the
NQ and ES futures charts and on the QQQ and DIA tracking
stocks. If the Triangle short signal has been triggered then I
click a button looking for any bearish candlestick patterns for a
good short entry. If the Triangle trend bullish trigger has been hit
then I click a different button and scan for any bullish candlestick
patterns on the 5 minute charts. If you cannot make money
trading with these signals then I suggest you find another
occupation.
Before I give a description of the various candlestick formations
that the program will scan for and how to trade them I would like to
first briefly cover two additional functions that I have coded into
my program. The first is a very good Support and Resistance
tool. Clicking the 6 button in the program allows the user to
scan for the highest high and the lowest low within a user defined
previous number of bars. The data is printed in the data
output window for easy review and storage. You can do this in
any time frame, which makes it very useful on an inter day
basis.
For example, after the first 30 minutes of trading I just click a
button and within seconds alerts are set at all short term support
and resistance levels. Thirty minutes later I just clear the
existing alerts, click the button and the new price support and
resistance alerts are set. How easy is that. Thank you
Ensign.
Finally, most traders use what I refer to as conventional studies
such as the Relative Strength Index or Stochastic. With that
in mind I added a conventional Ensign studies scan to the Triangle
program. It allows the user to input up to three different
Ensign studies and scan your quote page symbols for various data.
For example, I like to scan the 60-minute charts looking for RSI in
oversold or overbought territory. The user of the program can
input what values you want to search for as extremes. If you
want to look for RSI over 70 but Stochastic over 80 you just input
those numbers on the main page of the program and click the
button. Ensign does the rest of the work for you without you
having to review one chart.
In addition to the various studies, Ensign provides what are
known as study flags. These flags provide you with very useful
information about the various studies. For example, when you
scan for RSI above 70 or below 30 you also can enter a flag number
that will provide a true false statement about the direction of the
study average. If the study average is rising it will print
true if one flag is entered. My program allows any combination
of studies and flags to be used in the scan mode.
In this section of the article I am going to give a brief
description of the individual candlestick formations that the
program will scan for in any time frame. Each will have a
chart example showing what makes the pattern and how to trade
them. In honor of this very large bear that has been making
himself right at home for some time now I will begin with the
bearish candlestick patterns. Then I will finish up the
bullish candlestick formations for your review.
CANDLESTICK PATTERN FORMATIONS
These are all well-known formations that present great trade
opportunities. The patterns are most reliable when they occur
at or near either a Fibonacci support or resistance level.
Additionally, it is best to trade candlestick formations as signals
to the end of a counter trend. On the main page of the program
the user can turn on or off the scan for whichever one of the
formations that you want. You can also control if you want an
alert set or not. This is a very useful function. For
example, if you want to keep the alerts set from the daily signals
active, however at the same time you want to continue running the
scans on your 5 minute inter day charts, you just disable the alerts
settings.
For all traders that only trade the mini’s these candlestick
formations can be of great use even if you do not trade individual
stocks themselves. I have found that scanning the list of
individual symbols that make up the DIA provides much needed
information about impending moves in the market tracking stocks or
futures. When the scan pulls up 10 or 15 bullish signals it
provides an early warning of a possible reversal in the
futures. Also, all the candlestick patterns also occur on the
individual futures charts.
BEARISH CANDLESTICK FORMATIONS
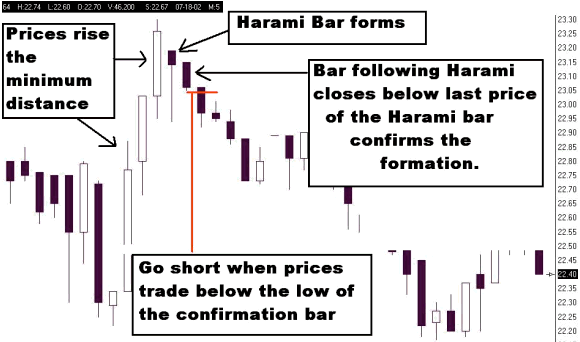
- BEARISH HARAMI – This is a bearish reversal pattern.
Prices will have been rising when the last bar in the formation
stalls. The body of the last bar is contained within the
body of the previous bar. The last bar is a bearish reversal
bar. Go short when prices trade below the low of the last
bar in the formation. Place a stop loss at the high of the
last bar in the formation.
Note: There are various combinations that make up a bearish
Harami formations. The body of the bar that contains the
Harami bar can be a bearish bar instead of the bullish bar used in
the chart example.
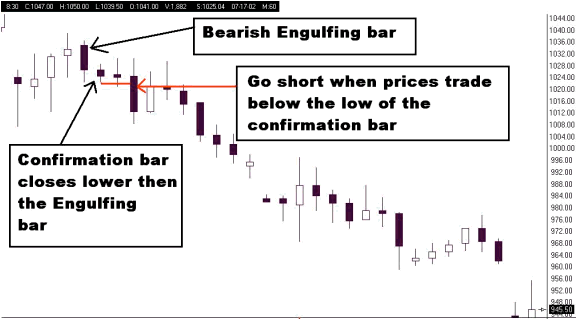
- CONFIRMED BEARISH HARAMI (Three Inside down) – This
formation occurs when the bar after the last bar of the bearish
Harami pattern confirms the bearish pattern by closing below the
closing price of the bearish Harami bar. The signal is to go
short when prices trade below the low of the last bar of this
pattern. This pattern occurs regularly and is considered a
stronger bearish signal then the Harami pattern.
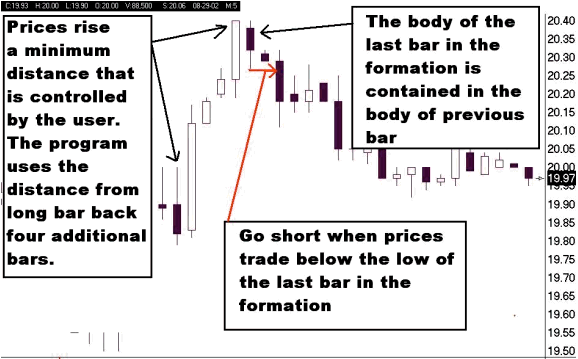
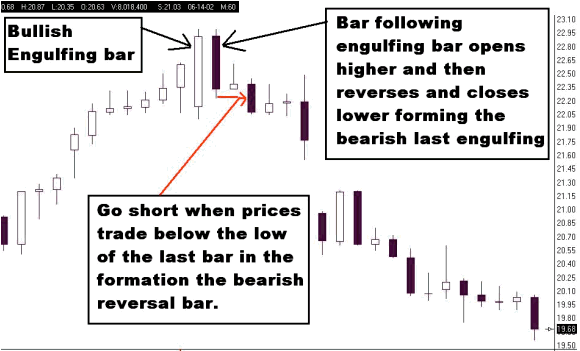
- BEARISH ENGULFING – This pattern is formed when prices have
been rising and the last bar in the formation gaps open higher in
the direction of the bullish trend and then reverses and closes
lower then the main body of the previous bullish bar. This
creates a bearish reversal bar that is engulfing the previous
bullish bars body. Go short when prices trade below the low
of the last bar which is the engulfing bar. Use the high of
the engulfing bar for your stop loss. If prices are to far
away for a stop loss pick a logical stop.

- CONFIRMED BEARISH ENGULFING (Three Outside down) – This
pattern occurs when the bar after the last bar of the bearish
engulfing pattern confirms the bearish pattern by closing below
the closing price of the bearish engulfing bar. The signal
is to go short when prices trade below the low of the last bar of
this pattern. This pattern is considered more reliable then
the bearish engulfing formation.
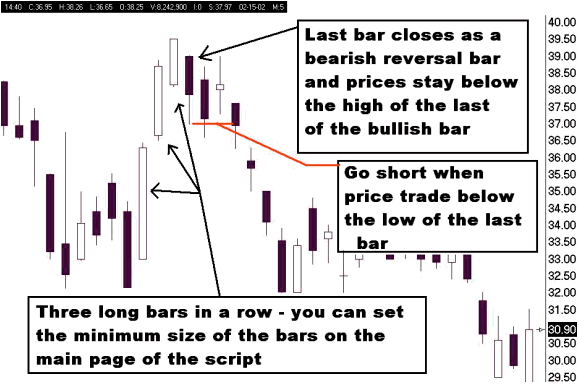
- BEARISH JB- This is a formation that occurs when you have
three long bullish bars in a row each with a higher high.
The last bar in the formation fails to reach the high of the
previous bar and that bar is a narrow range bar. Go short
when prices trade through the low of the last bar in the
formation. In Section 6 of the main page of the script the
user can control the minimum values for the up moves in the three
up bars of the formation and the maximum size of the last
bar. This allows you to use higher values when scanning
daily signals as opposed to a 5-minute intra day scan. Use
the high of the last bar as your stop loss. (This is not a
well-known candlestick pattern it is just something that I have
seen so many times before that I included it in the scan).
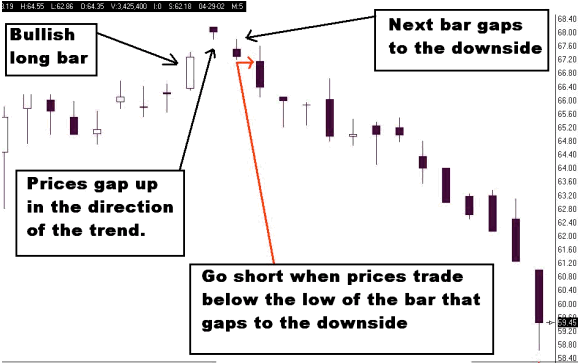
- BEARISH ABANDONED BABY- This is a reversal pattern of
the bullish trend. Prices are rising and then a price bar
gaps up. This gap bar is a narrow range bar. The low
tail on the gap bar does not overlap the high of the previous
bar. Prices then gap down on the following bar and close
lower then they opened. Go short when prices trade below the
last bar in the formation. On the main page of the program
you can control the minimum size of the first gap up bar. If
you only want the gap bar to be a star or Doji star you reduce the
maximum star value control. Use the high of the last bar in
the formation for your stop loss.
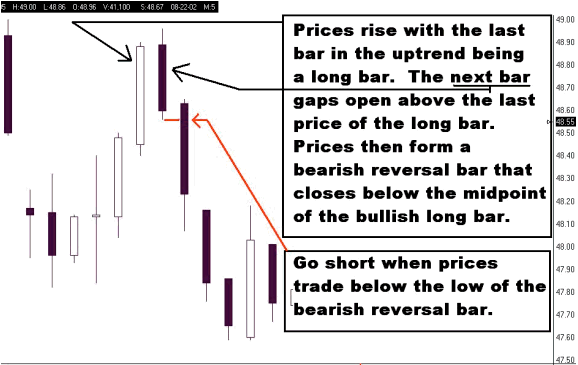
- BEARISH DARK CLOUD – This is a reversal pattern that occurs
when prices have been rising. First you get a long bullish
bar. That is followed by a bar that gaps open above the last
price of the long bullish bar but then closes below the mid point
of the long bullish bar. Go short when prices trade below
the low of the last bar in the formation. On the main page
of the program you can control the minimum size of the long
bar. This should or can be adjusted according to the time
frame that you are scanning. A long bar on the daily chart
is a different value then a long bar on the five minute
chart. Use the high of the last bar in the formation as your
stop loss.
- BEARISH LAST ENGULFING - This reversal pattern is formed
when prices are rising. A bullish engulfing bar then
forms. (Refer below to Bullish Formations). The price
bar after the bullish engulfing bar is a bearish bar that closes
below the close of the bullish engulfing bar. This pattern
is most reliable if it occurs at a recent 14 period high. Go
short when prices trade below the low of the last bar in the
formation. Use the high of the last bar for your stop loss.
- BEARISH KICKER - This pattern can signal a reversal of
prices. It can occur anywhere on the chart and will signal a
reversal of the current trend. This scan is also controlled by the
PointLossBeforeReversal and PointGainBeforeReversal controls on
the main page of the program. The bearish kicker is a two
bar formation where the first bar is a bullish bar. The next
bar opens at the same price that the bullish bar opened but
reverses direction and closes as a bearish bar. Go short
when prices trade below the low of the second bar. This
formation is most effective if both bars are not narrow range
bars.
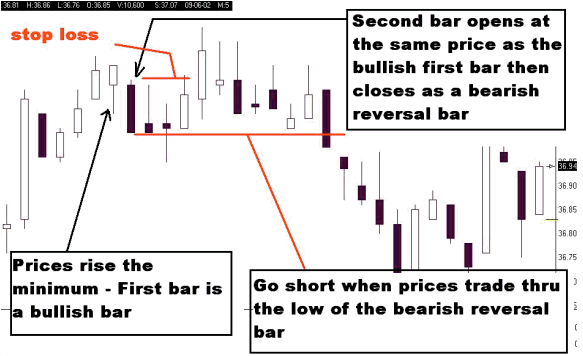
In this 5-minute chart example you can see that depending on your
trading style this trade could be a winning trade or you could be
stopped out for a loss. Wait for prices to close below the low
to enter. If you enter aggressively and prices reverse to the
upside it is much more prudent as a trader to exit the trade when
the stop is hit and then reenter the trade a second time.
Commissions are a much less painful then waiting around to see if
the signal is correct.
BULLISH CANDLESTICK FORMATIONS
- BULLISH HARAMI – This is the reverse of the bearish
Harami. It occurs when prices have been falling and then the
last bar stalls and does not trade below the close of the previous
bearish bar. The Harami bar closes below the open of the
previous bearish bar. Therefore the body of the last bar is
contained within the body of the previous bearish bar. Go
long when prices trade above the high of the Harami bar.
Place a stop loss at the low of the Harami bar.
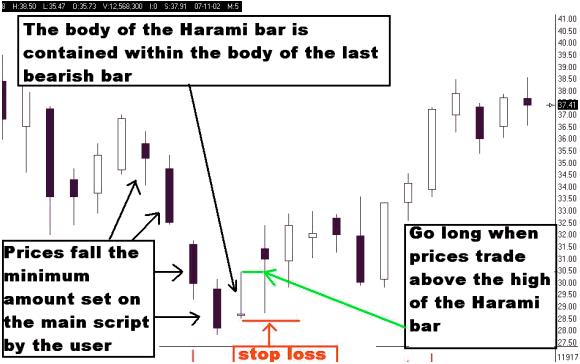
Note: There are various combinations that make up a bullish
Harami formation. The body of the bar that contains the Harami
bar can be a bullish bar instead of the bearish bar used in the
chart example.
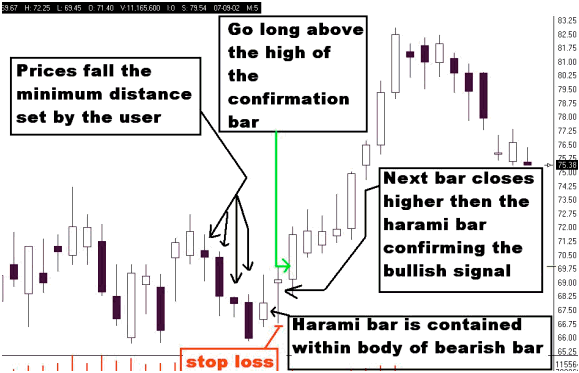
- CONFIRMED BULLISH HARAMI (Three Inside Up) - This
formation occurs when the bar following the formation of a bullish
Harami bar closes above the close of the Harami bar. This is
a confirmation of the bullish Harami and a stronger signal.
Go long when prices trade above the high of the last bar in the
formation. Use the low of the last bar for your stop loss.
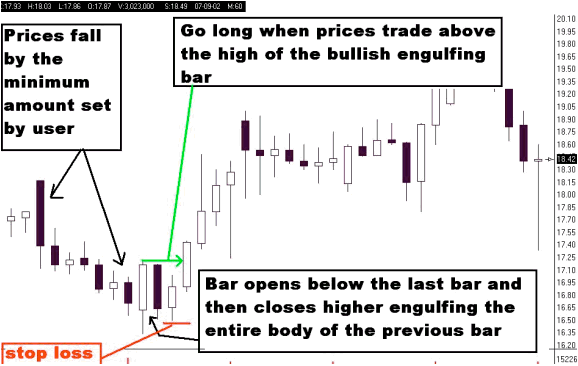
- BULLISH ENGULFING - This formation occurs when prices have
been falling a minimum amount. The last bar in the formation
gaps lower at the open and then closes above the open of the
previous bearish bar engulfing the entire body of the bearish
bar. Go long when prices trade above the high of the bullish
engulfing bar. Use the low of the engulfing bar as your stop
loss.
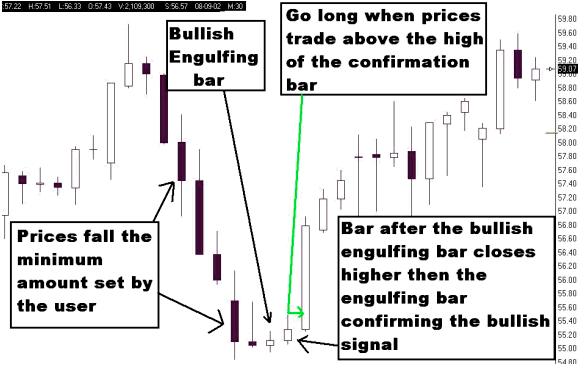
- CONFIRMED BULLISH ENGULFING (Three Outside Up) - When
prices first form a bullish engulfing pattern if the next bar
closes above the last price of the bullish engulfing bar then the
pattern is confirmed and is a stronger signal then the bullish
engulfing signal. Go long when prices trade above the high
of the last bar in the formation. Use the low of this
confirmation bar for your stop loss.
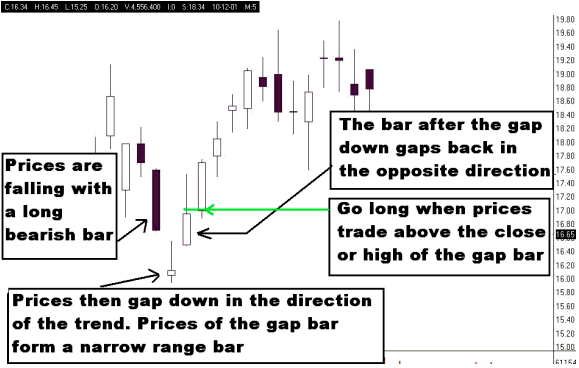
- BULLISH ABANDONED BABY- This is a reversal pattern that forms
when after prices have been falling a price bar gaps lower.
This gap bar is a narrow range bar and does not overlap with the
previous bearish bar. The next bar gaps to the upside and
closes higher then it opened. Go long when prices trade
above the high of the last bar in the formation. Use the low
of the last bar for your stop loss.
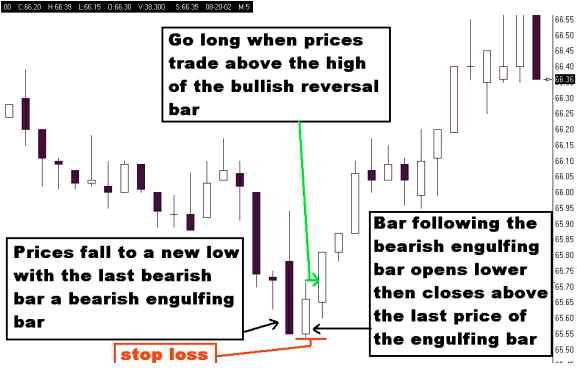
- BULLISH LAST ENGULFING - This pattern is a reversal pattern
that occurs when after prices have fallen to a new low prices form
a bearish engulfing bar. The bar following this bearish
engulfing bar reverses to the upside and closes above the last
price of the bearish engulfing bar. If it occurs at a 14
period low it is more reliable. Go long when prices trade above
the high of the last bar in the formation. Use the low of
the last bar for your stop loss.
- BULLISH KICKER – This reversal pattern occurs when the first
bar of the formation is a bearish bar. The second bar opens
the same as the first bar but goes in the opposite direction and
closes as a bullish reversal bar.

SAMPLE OUTPUT
When you run the bullish or bearish candlestick scan all relevant
information is displayed in the script editor output window. Below
is an example of how the data appears and the information
provided.
-Bearish JB - possible reversal
.
This tells you the name of the formation found.
NQ #F Last
Price=910
This tells you the symbol and the last price
traded
09-03-02
This tells you the date of the
signal
1300
For the Inter day scan mode this line will provide the time of the
bar that follows the last
bar
of the formation that has been located. Using the End of Day
scan this bar time will indicate
the
bar time for the last bar of the formation.
Resistance
=907.5
This gives you the current support and resistance
values
Support
=904.5
based upon the values you input on the main page.
**Signal Bar
Volume Alert (Signals high volume on last bar in
formation)
*Formation Volume Alert (Signals high volume
when formation is found)
In conclusion, it should be clear that there are many
combinations of these various functions that the Triangle
program will perform that can be of great use to every trader.
For example, you can use the conventional studies scan to find a
list of stocks that are in over bought territory. Then use the
bearish candlestick scan on that list looking for a top to
short.
On some days due to market conditions there may not be any
candlestick patterns that form on the 5 minute chart. On most
days there are plenty. If however there are no candlestick
patterns to trade it is quite easy to use the short term support and
resistance levels to find trade opportunities. The
combinations and uses are only limited by your own
imagination. Good luck.
Triangle Buy Signals from Daily QQQ tracking stock.
10/03/2001 – Buy at 30.43
10/11/2001 – Buy at
33.20
11/06/2001 – Buy at 37.06
12/04/2001 – Buy at
40.49
12/06/2001 - Trigger price 43.24 (Prices never tested
trigger price)
05/17/2002 - Trigger price 33.41 (Prices never
tested trigger price)
07/08/2002 - Trigger price 26.55 (Prices
never tested trigger price)
01/16/2002 - Short at
39.15
02/04/2002 - Short at 37.33
02/19/2002 - Short at
34.97
06/07/2002 - Short at 28.42
07/23/2002 - Short at
22.73
That is a track record of 9 for 9 (100%) on the QQQ signals since
the program was released in September of 2001.
Note: You cannot trade with a weak computer system.
Every time your system locks up or cannot handle the data or charts
you risk losing more money then what a good new system will
cost. I had a great high test 4 monitor system built by a
customer of mine and a fellow Ensign user Dale Fisher. You can
contact Dale at tigocerous@tigocerous.com
Note: (10-26-2004) After reading your newsletter
article about selling trading systems I came to the conclusion that
you were right as usual. I stopped offering my program to the
public and went back to what I do, trade. Trying to
provide support became a huge burden and was not worth the
effort. I would be on line answering questions to get a
monthly fee and end up missing a trade that would cover a hundred
customers. Additionally, as you are well aware, what works
fine for one person may be considered trash by another. I
love Ensign. And I love my program, which has been refined and
improved. If you want to add a note with the article
that I am no longer offering the Triangle program that would be
great. |