March 2003Trading Tip:
Projected Fibonacci
Targets
by Mohab Nabil
Here is a new technique for determining price targets after a
breakout from a previous price swing. Fibonacci analysis,
which is employed by practitioners of various sciences such as
astronomy, mathematics, and architecture, also has a role in
projecting price targets of financial securities. After
working with Fibonacci ratios for several years, I developed a new
technique for determining price targets after a breakout (up or
down) from previous price swings, which I call Projected Fibonacci
Targets (PFT).
The Basics
Before applying the PFT, it is important to
understand that broken support levels often become resistance levels
during subsequent rallies, especially if a broken support level
coincides with a Fibonacci retracement level.
Figure 1 show a hypothetical example of a price downswing from
point A to point B, followed by a consolidation area, and finally a
breakdown to point C (a classic example of a downtrend). The
broken support level established during the consolidation now acts
as resistance for the subsequent rally. The resistance at $60
also represents a 50% retracement of the move from A to C ($100 to
$20).
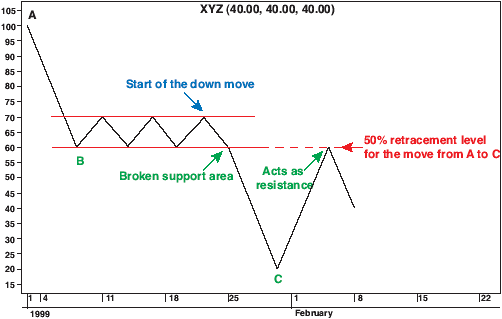
Figure 1 - Classic Example of a DownTrend
Figure 2, the chart of Xilinx, Inc, (XLNX), from
October 4, 2000, to November 2001 shows a downswing from point A to
point B. The trend halted temporarily and formed a
consolidation area with support at around $58. After breaking
below $58, the new downswing reached a low of $35. Prices then
rallied from this low back to $58 -- an important level, because it
was the support level of the previous consolidation. It has
now reversed its role and is acting as resistance. The move
from $35 to $58 is approximately a 38.2% retracement of the move
from $92 to $35 ($92-$35 = $57 * 0.382 = $21.77 + $35 = $56.77).
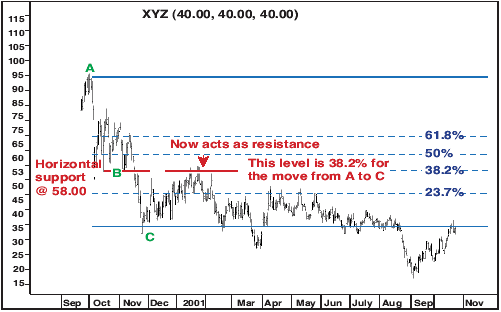
Figure 2 - Xilinx, Inc. (XLNX)
This example reveals that when a resistance level (or
a support level) is formed by breaking previous support (or breaking
previous resistance), it often coincides with a Fibonacci ratio (of
23.7%, 38.2%, 50%, or 61.8%) of the whole move, resulting in a
resistance (or support) level that is not easily breached.
The Technique
The major premise behind the
PFT is that market swings in the same direction relate to each other
from the point of breakout. Hence, the move from B to C in
Figure 2 relates to the move from A to B by a Fibonacci ratio.
It is important to note the relationship between the two swings
originates from the breakout of the support or resistance level, and
not from the beginning of the second swing in the same
direction.
Based on this principle, we can conclude that breakout
points represent important Fibonacci retracement levels for
subsequent corrections. Therefore, price targets can be
derived by assuming that a breakout point is one of the Fibonacci
retracement levels, and that the trend should continue till it
breaks a support/resistance level (established by the Fibonacci
retracement levels) and starts a countertrend correction.
By using this technique, you will be able to project
future price targets:
Projected Fibonacci Targets use four Fibonacci
ratios: 23.7%, 38.2%, 50% and 61.8%.
If prices break out
of a horizontal support/resistance level, apply the following
formula:
PFT = (Fibonacci ratio * A - B) / (Fibonacci
ratio - 1)
where:
A is the
point where the first price swing started
B is the
point where the first price swing ended (horizontal
support/resistance)
Fibonacci ratio is one of the
following: 23.7%, 38.2%, 50% and
61.8%
You will have to solve for four targets, one for each
of the four Fibonacci ratios. An example of PFT application is
displayed in the chart of the Dow Jones Industrial Average (DJIA) in
Figure 3.
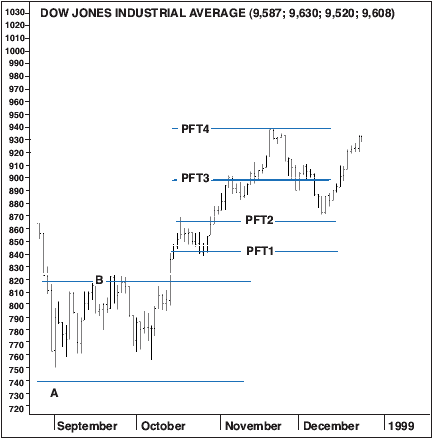
Figure 3 - Project Fibonacci Targets in an Uptrend.
Note how price levels coincided with the four
levels. An upswing beginning from point A (7400) to point B
(8180) was followed by a downside correction. It is only after
prices break out above the resistance that you can apply the
PFT. Then you calculate the four target levels using the PFT
formula:
PFT1 = (0.237 * 7400 - 8180) / (0.237 - 1) =
8422
PFT2 = (0.382 * 7400 - 8180) / (0.382 - 1) =
8662 (which halted the advance temporarily)
PFT3 = (0.500 * 7400 - 8180) / (0.500 - 1) =
8960 (which halted the advance temporarily)
PFT4 = (0.618 * 7400 - 8180) / (0.618 - 1) =
9442 (which halted the advance temporarily)
You can apply this technique to a downswing in a
similar way. The weekly chart of the FTSE 100 index in Figure
4 show a downswing starting at point A (6951) and ending at point
B(5973), followed by a congestion area that lasted for more than 10
months. After this consolidation, prices broke out below the
support level.
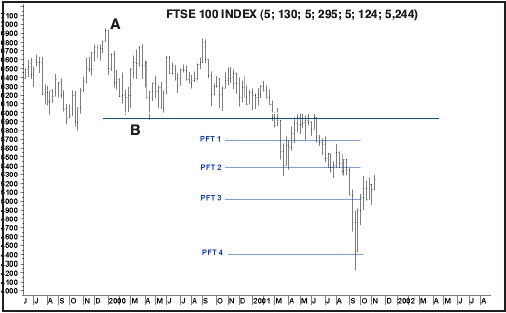
By applying the PFT formula, you come up with
the following price targets:
PFT1 = (0.237 * 6951 - 5973) / (0.237 - 1) =
5669
PFT2 = (0.382 * 6951 - 5973) / (0.382 - 1) =
5368 (which halted the decline temporarily)
PFT3 = (0.500 * 6951 - 5973) / (0.500 - 1) =
4995
PFT4 = (0.618 * 6951 - 5973) / (0.618 - 1) =
4391 (which halted the decline temporarily)
Money Management
The PFT points may also
signal trend reversals, making them a handy tool for applying money
management strategies. The chart displayed in Figure 5
illustrates how this can be done.
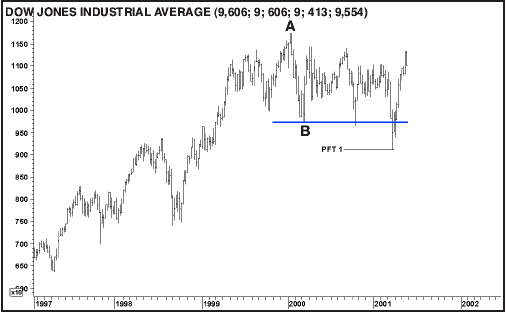
Figure 5 - PFT as a Money Management Tool
A downswing starts at point A (11750) and ends at
point B (9732), followed by an upward reaction, and ultimately a
breakdown through support at B. If you apply the PFT formula,
you can calculate the value for the first projected target:
PFT1 = (0.237 * 11750 - 9732) / (0.237 - 1) =
9105
The PFT was reached, as the low for the DJIA was 9107,
only two points away from PFT1. As can be seen in Figure 5,
PFT1 marked an important reversal in the weekly trend as the DJIA
rallied again, suggesting that you could use it as your exit
point.
Conclusion
Like all indicators, the
Projected Fibonacci Target (PFT) is not a stand-alone technique, but
because of its effectiveness and accuracy in projecting price
targets, it should be one of the many tools in a trader's
toolbox. It works because same-direction market swings are
often related by Fibonacci ratios from the breakout point of
previous support or resistance levels. These points can be
combined with sound money management strategies to minimize risks
and maximize profits.
Mohab Nabil, a full member of the Society of
Technical Analysts UK, has published numerous articles on technical
analysis for both Egyptian and international journals. He
teaches a technical analysis course at Regional Information
Technology Institute (RITI) in Cairo, Egypt. He trades the US
equity markets and carries out his own research, with his main focus
on pattern recognition and cycle analysis. He may be reached
at mohab12@yahoo.com.
With special thanks to Mr. Norris.
Trading Tip:
Trader Chat Rooms
by
Howard Arrington
Ensign Windows has a built-in Chat Room capability where traders
meet and exchange insights and help each other. What makes
this chat feature unique is the ease with which traders can share
images of the charts they are working with. The upper portion
of the chat room is a fully functional web browser. The lower
portion of the chat room is where messages are
exchanged. Ensign Windows has the ability to upload to
any web site chart images by pressing CTRL-J. The link to
these uploads can be automatically posted in the transcript and
automatically viewed by the patrons in the chat room.
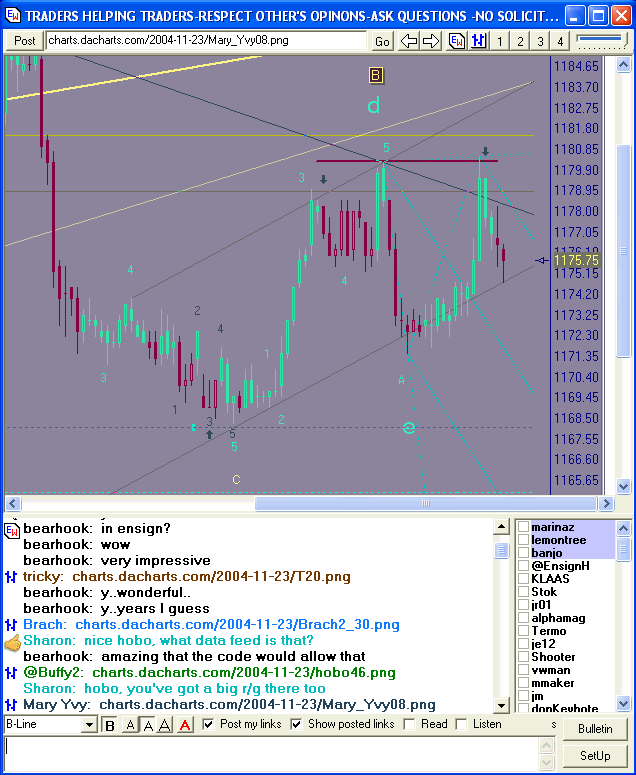
You do not have to be an Ensign subscriber to use the
chat room. Just download and install
the EChat version of Ensign Windows from the Ensign web site.
Use EChat to be in communication with other traders in one of the
chat rooms that are selected by tabs on the bottom of the text input
window. In Ensign Windows, click on the Chat Room button on
the main toolbar to open the chat room. The Chat Room button
has a face as the image on the button.

After opening the chat room, click on the SetUp button
on the lower right corner of the form. This gives you an
opportunity to enter a nickname you will be known by in the chat
room. The members list can be shown or hidden.
This image shows an example member list.
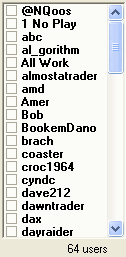
Double click on a member name to send a private
message to the person. Or, click on the square box by a member
name to page the person with both a message and a sound. This
is a great way to let someone know you are trying to reach them and
want their attention for a moment in the chat room. The '64
users' indicates the number of patrons in the chat room.
You are invited to install EChat, and join other
traders in the chat room. Many who have published
articles in past issues of the Trading Tips newsletter patronize the
B-Line chat room. Please come join the growing audience of
traders who keep in touch with each other in the Ensign chat rooms.
|