March 2004
Trading Tip:
Price and Time
by Larry
Pesavento
The year 2000 will be remembered in the financial history books
as the year of the top of the greatest bull market in stocks in the
United States. However there was another event with far less
fan fare that occurred in the spring of 2000! Business Week in
its April 17th issue published an article titled "This
Alchemy can yield gold." The article summarized the research
work of Dr. Andrew Lo and his colleagues from the school of applied
mathematics at Massachusetts Institute of Technology (MIT).
Dr. Lo examined over 30 years of chart patterns (over 60,000) from
1962 to 1996 in an attempt to prove or disprove the mystery of
technical analysis of chart patterns.
Lo’s theory was based on the premise that certain price patterns
repeat in actively traded markets. The results of the study
were nothing short of amazing. Indeed, the classical chart
patterns such as head and shoulders, double tops and bottoms,
pennants, flags and other popular chart patterns were not only
identifiable but highly predictive of future price movement.
These accolades from academia were heralded in the financial
press as finally giving the technicians an equal playing field with
the fundamental trader. Statistically, the study proved that
reading chart patterns can yield startling results in portfolio
performance.
Price movements in actively traded markets are chaotic in
nature. One can never predict what the next price movement
will be; up or down. Nor can anyone ever know how much they
will make on a trade (or if it will even be profitable). So
why even bother to try and predict price movement? The answer
lies in the control of risk. Risk is the only factor in the
risk reward equation that a trader can control. Great traders
learn the lesson early in their careers. "Take care of your
losses and the profits will take care of themselves" was the trading
advice of Amos Barr Hostetter, founder of Commodity Corporation and
a mentor to many of the Market Wizards.
Within the chaos of market activity are non-random patterns that
repeat and are also identifiable. This happens because markets
can only do three things; go up, go down or go sideways.
Unfortunately they sometimes do all on the same day. However,
there are certain patterns that occur on an almost daily basis
allowing the pattern recognition trader a valuable window of
positive probability. Probability is the key word here!
Traders deal in probabilities – never in certainties. Only two
professions deal in certainties – tax accountants and
morticians.
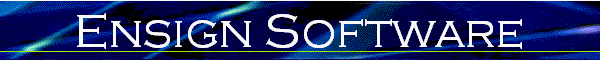
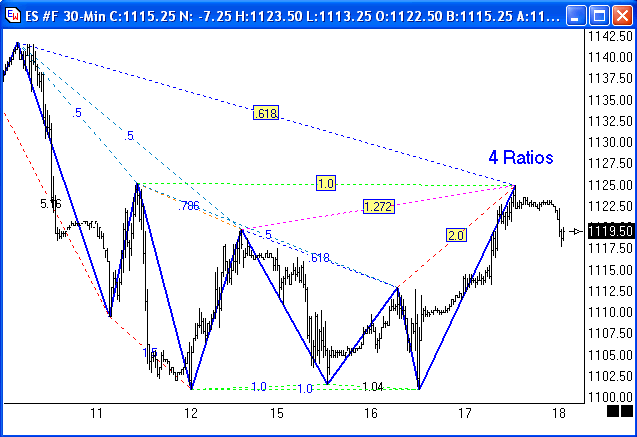
Ensign Software has developed a pattern recognition tool that
automatically calculates the exact ratios from previous price
swings. Non random patterns occur because all price swings in
the past have an effect to future price swings. This is why
pattern recognition trading is predictive and acts as a leading
indicator as opposed to oscillators and moving average systems that
are lagging indicators.
Knowing the ratios is the first step in pattern
recognition. Ensign’s tool "Pesavento
Patterns" does the work instantly for the trader. It
allows the trader to select the price swings over any time frame
from tick charts to monthly charts. The trader must then
select the pattern recognition trade that fits his own
"psyche". Pattern recognition is the key! Head and
shoulders, pennants and flags and many other patterns have those
important ratios needed to confirm the validity of the pattern.
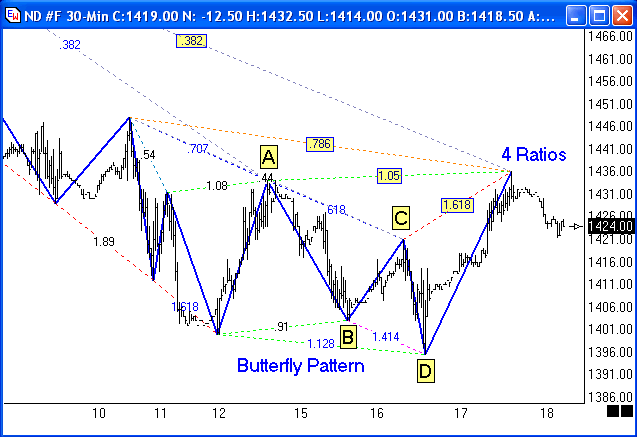
Personally, I think the Pesavento Pattern is a very
valuable new tool for swing traders. The value resides in its
graphic presentations of all past price swings. Each price
swing repeats at some future point in time. The index allows
the trader to see not only the ratio of all swings but the exact
number of points in the swing. Knowing the intrinsic harmony
of each or commodity is necessary to understanding future price
swings. Markets expand and contract in relationships that are
illustrated by the Fibonacci summation series.
When using the Pesavento Pattern it is best to wait for
the multiple patterns and ratios to form and complete as shown on
the examples in this summary. It takes time to understand the
significance but it is time well spent. Each stock chart has
its own pattern and harmony. Find stocks and commodities that
have symmetrical patterns that are easy to understand. That
assumes that you study pattern recognition in depth.
Time is most elusive of all technical indicators. From the
words of the great New Your Yankee Yogi Berra – "It ain’t over till
it’s over". This certainly applies to trading stocks and
commodities.
The Ensign Software Ensign
Map has been quite successful in locating key times for
trend reversals when day trading. Based on the principle that
markets can only go up, go down or go sideways the Map searches for
similar patterns that have repeated over the past several days and
then defines a trading "Map" for the next several trading
hours. The "Map" is not a stand alone trading plan but must be
used with support and resistance points and strong money management
rules. I use the default settings provided by Ensign and I do
not change them at any time. My experience using the Map has
been helpful in the first hour of trading. The first hour of trading
is sometimes referred to as "Amateur hour" by the financial
press. The map has a tendency to give better entry signals
after the first hour of trading. The Map can also be helpful
on strong trending days, which occur about 15% of the time.
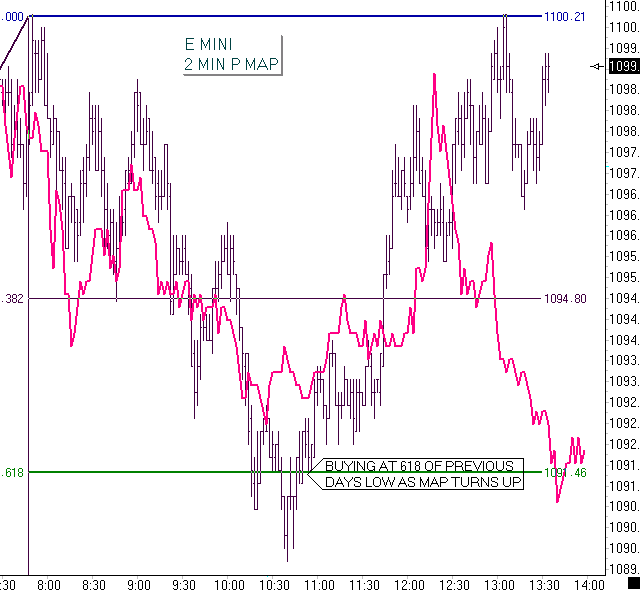
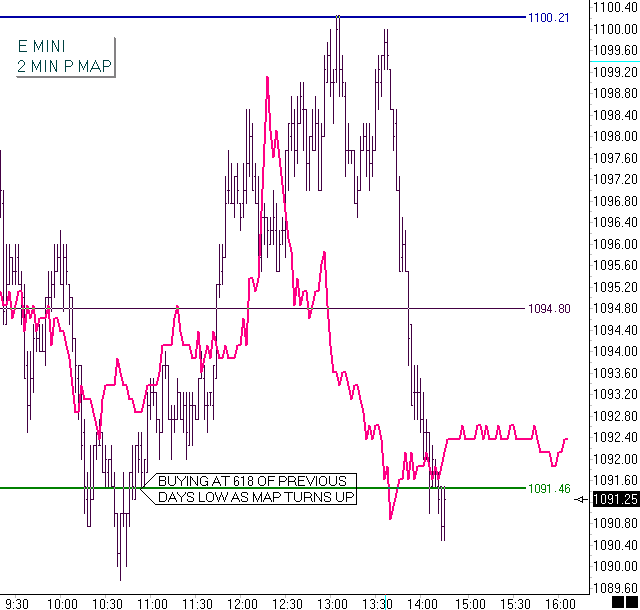
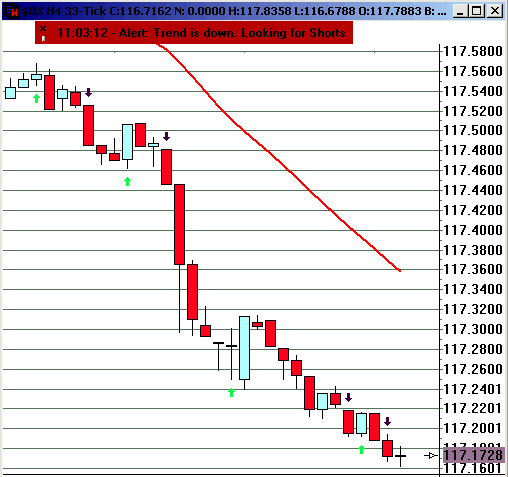
These 2 charts show the Ensign Map I used for trading ES
M4 on March 23rd. The Map is the red line. My time
objective was 10:30 and my price objective was the 0.618 retracement
marked by the green line. Pretty good I think!
Taking a combination of the Pesavento Patterns and the
Ensign Map is probably the best use of these tools.
When the map is indicating a price reversal and several key
Fibonacci ratios are present an ideal trading set up is in
play. But it is only a probability, never a certainty.
Money management and risk control is of paramount importance in
trading. The use of these two tools is no exception and I urge
all traders to practice with paper trading before using real
capital.
Trading Tip:
Custom Currency Index
by Christian Czirnich
If you trade currency with the Interactive Brokers (IB) feed, you
might miss a nice Index available from NYBOT. The Dollar Index
futures ($DX) is composed of a basket of six major currencies (Euro,
Yen, British Pound, Canadian Dollar, Swiss Franc and Swedish Krona)
http://www.nybot.com/specs/dx.htm
I use Ensign Windows to recreate a currency index as a custom
symbol, with one exception. The basket currency Swedish Krona
is not available from IB. But the Australian Dollar is
available and having seen the nice move the Australian Dollar
futures made and seeing the average volume in the futures is
comparable to the CAD or CHF, I have replaced the Swedish Krona with
the AUD in my new Dollar Index. Here is my setup:
1. Click menu Set-Up | Customs symbol:
2. Enter the following information (For the June
series use M4. For the March series use H4).
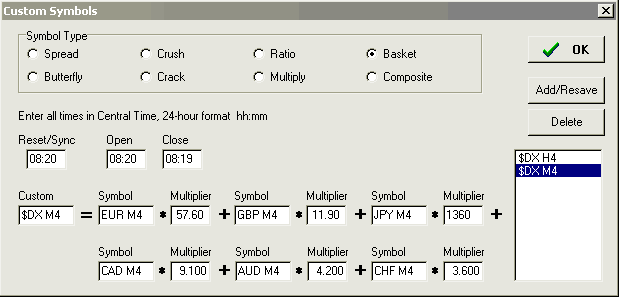
Only difference to the "real" DX index is that the Swedish Krona
has been replaced with the Australian Dollar. This was
necessary since IB does not carry the Swedish Krona futures.
Of course this change makes the value you get for this $DX custom
symbol different from the real dollar index. But, you don't
want to trade it, you just want a currency index, which might move
faster than the currency you are trading.
Click Add/Resave and close the Custom Symbols window.
3. Add the new $DX H4 to a custom quote page in Ensign
Windows.
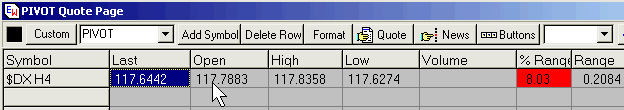
4. Open a chart for your new $DX H4 index symbol.
|