February 2005Trading Tip:
New Candle Types
by
Howard Arrington
Ensign Windows has introduced
four new candle types. The reason why will be explained and
illustrated in this article.
Bar Chart
The standard bar chart draws a vertical line between the
High and the Low. The Open price is shown with a hash
mark on the left side of the line. The Close price is
shown with a hash mark on the right side of the line. |
 |
| Candlesticks
A candlestick shows the same Open, High, Low and Close
information as the standard bar. A rectangle (candle
body) is drawn between the Open and the Close.
Since the left side / right side relationship has
been lost, the type of rectangle used indicates the Open and
the Close.
A solid candle body is drawn for a Down Candle when the
Close is below the Open. Therefore, the Open is at the
top and the Close is at the bottom.
A hollow candle body is drawn for an Up Candle when the
Close is above the Open. Therefore, the Open is at the
bottom and the Close is at the top.
|
 |
Framed Candles
This variation of a standard candlestick outlines the
candle with a frame. The Down Candle bodies
(solid) are colored. The Up Candle bodies are
hollow. |
 |
| Solid Up Candles
This variation of a Framed Candles draws the Up Candles
with a solid body instead of a hollow body. One
color is used for every Down Candle, and a different color is
used for every Up Candle.
The Close price is at the bottom of a Red candle body, and
at the top of a Green candle body. The Open price is on
the opposite end of the candle body from the Close
price. |
 |
| Color Bars
Standard bars can be drawn using color to indicate bar
relationships, study relationships, trends and alert
conditions.
This example uses 4 colors to show these Dunnigan Bar
relationships:
- Up bars are shown
in green.
- Down bars are shown in
red.
- Inside range bars are shown
in blue.
- Outside range bars are
shown in black. |
 |
Color Candlesticks
Candlesticks can also be drawn using color. This is
the same Dunnigan Bars example as the previous Color Bars
example.
Both the frame and the body must be colored.
This is because the Open and Close relationship is indicated
by the candle body being solid or hollow. |
 |
| Ensign Corners™
Ensign has introduced 4 new candle types so that the candle
bodies can be solid and colored with any color. This
eliminates the Open/Close relationship information because
there are no hollow candle bodies to indicate when the Close
is above the Open. Therefore, variations on the candle
frame are used to indicate the Open and the Close.
Ensign Corners™ is a blend of a standard bar and a
candlestick. The Open is shown with a hash mark on the
left side of the candle body. The Close is shown with a
hash mark on the right side of the candle body.
|
 |
| Ensign Zebras™
This variation draws a diagonal line across the candle body
from the Open on the left side to the Close on the right
side. The diagonal line is a quick visual indication of
whether the candle is a Down Candle or an Up Candle.
Since the candle bodies look like forward or backward Z's,
the name for this Z-bars presentation format is Ensign
Zebras™.
|
 |
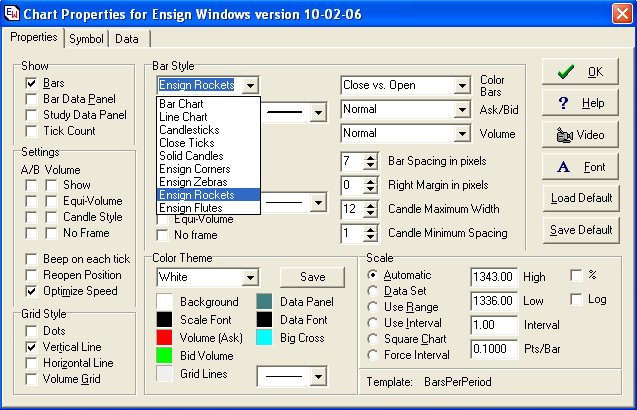
| Ensign Rockets™
This variation uses a different line thickness for the
candle wicks and one edge of the candle body frame. This
presentation format is called Ensign Rockets™.
The wick and body edge on the Open side of the candle body
are drawn with a thicker line. This is the thrust side
of the Ensign Rocket.
The Close side of the candle body is the Rocket nose, and
shows the direction the Rocket is headed.
|
 |
Ensign Flutes™
The final variation draws a rectangle from the High to the
Low instead of from the Open to the Close. Like a
standard bar, the Open price is shown with a hash mark on the
left side. The Close price is shown with a hash mark on
the right side.
This presentation format is called Ensign Flutes™. |
 |
Ensign Software is excited to announce this new innovation in
Ensign Windows. These new candle types permit Color Bar
studies to color the candle bodies with any color, yet retain the
Open/Close information in the candle frames. Ensign Windows
users need to upgrade to the Beta release. Open a
chart. Use menu Charts | Types to select one of the new candle
types, or press CTRL-P to show the chart property form and select
the candle type on the Chart Type drop down list. Enjoy!
Feedback:
'Just a quick note as the trading day progresses. I have to
say I was a little worried when you brought out the new candlestick
types. As usual you were right. Brilliant is the word
that comes to mind. I am using the Ensign Rockets this
morning. I am up 18 points in the Russell using these bars
alone. See attached chart. I am ignoring the other
indicators generally. I look for the thrusters to be on the
bottom for a long and then look at the 2997 Volume chart for a
confirmation of entry. If there is no arrow on the 2997 I
refuse the R1290 entry. So far today six trades, four winners
for the aforementioned 18 points on two contracts. I can go
play golf now! I added an arrow and the word “Chop” to
the chart. When there are no fat wicks and tails to the bars
it seems to indicate chop. That’s a wonderful chop indicator
if it works out. Thank you for your continued outstanding work
in our behalf.' -J. West 02-17-2004
(charts shown with J.'s permission)
Trading Tip:
Candle Recognition
by
Howard Arrington
The following example color
codes different specific Candle formations. This is a clever
use of the new Ensign Rockets™ and Ensign's powerful Design Your Own
Study feature.
Line A detects the Doji formation, where the Close
price equals the Open price, and labels this candle with the letter
D.
Line B detects the Hammer formation, where Close and
Open are in the upper part of the range. Body is colored
magenta.
Line C detects the Gravestone formation, where Close
and Open are in the lower part of the range. Body is colored
yellow.
Line D detects a strong up move. Close and Open
are in the outer extremes of the candle range. Body is colored
green.
Line E detects a strong down move. Close and
Open are in the outer extremes of the candle range. Body is
colored red.
Line F detects a Spinner formation, where both Close
and Open are in the middle of the range. Body is colored
cyan.
The Number field values control the # percentages for
the tests, and can be adjusted to suit your personal
preferences.
This example is available as the CandleRecognition
template which can be downloaded from Ensign's web site using the
Internet Services form.
Trading Tip:
Thoughts about Full Time
Trading
by Jay West
If you are serious about trying to become a successful full time
trader, I offer these comments. If not, stop reading. It
will be a waste of your time.
It takes a special mental intelligence and ability, as well as a
burning desire, and personal
discipline to become a successful trader. You can
have the best trading template, software, and platform in the world
and still may not be successful. Why is that? It
is almost always the temperament
and control of your emotions that
determines your destiny. Everyone needs to work on and
improve/change this personal situation to eventually become what
they want to be in trading. Trading
discipline is born from emotional control. Usually
traders are their own worst enemy. That, coupled with their
trading environment that is. Trading environment is critical
to success, but not as critical as the control of one’s
emotions. You must gain
control to be successful. There is no substitute
for this control. Nothing you can do to offset this deficiency
will help. How do you know if you are “out of control”?
Trading the “money” is probably the most universal tip off that you
are out of emotional control. The lack of ability to stop
trading when you are losing is also a good indicator.
How do you control emotions? Simply by trying to develop
patience and making your focus the system and not
the end results of your trading actions. Stay immersed in the present. In other words,
stay immersed in the process of trading. Reading the charts,
the indicators, the momentum or lack of it in the market.
That’s the way you communicate with the market and overcome
emotional urges. Do not try to outguess the
market. Stay away from “outcomes” or as I call it “what
if” thinking because that destroys your objectivity and focus on
what’s important and creates negative thought processes. If a
golfer focuses on whether or not he will make a three foot putt and
the consequences of missing it instead of the process involved in
making the stroke required to have a successful outcome he will
surely miss that putt. He places a huge monkey on his back by
worrying about the consequences of making or missing that
putt. Especially if there is pressure to make the putt such as
a double or nothing bet, carrying his share of the load in a two man
team event etc. The same thing happens in trading except that
there is usually much more pressure associated with that
activity. It can be almost a life and death situation if you
allow it to become that. This “outcomes” or
“what if” thinking causes you to lose your focus on the really
important things that will help you be successful.
What’s important is the step by step process of
trading. It really is as simple as that. At least
it was for me. Once I gained that perspective on approaching
the market, I had the control I needed and things started to get
better. Just remember the only thing you can control in
trading the market is how you react to the things you are
seeing. Control of your emotions is
critical in reacting in the correct manner to what you are
seeing.
Let’s get personal here. I had a non supportive family (my
wife hated me trading), a small account, and a lot of un-success to
overcome when I started trading. Sound familiar? The
only way I got out of it was to develop a
resolve that I would be successful and disprove all the nay
Sayers, no matter what. More importantly, I decided that I
would gain a patient attitude and “slow
things down” in my trading world. I adopted this concept of “slowing
things down” from statements I saw from highly successful
professional athletes and some teaching principles I used in
teaching Leadership in Army service schools. When Pro golfers,
Pro basketball players, and interestingly enough NASCAR drivers are
being highly successful, it is like everything slows down and it
becomes easy to see what to do and how to do it. Under the
tremendous stress of combat, the same thing occurs when a leader is
operating properly. It is like everything is in slow
motion. With this concept in mind, I picked the AB to trade
because it seemed to move slower than the NQ or ES. I tried to
select methods and time frames (R100 and R75) that were slower paced
in terms of signals. That would slow things down for me and
allow me to gain control of my emotions and decision making
processes. I got lucky. I found a great chat room where
a man named Woodie showed me the way to remain calm in the face of
adversity and that “a better trade was surely coming”. I also
found a great software company called Ensign Software and was able
to develop some fairly good templates that supported those
goals. The main thing I did however was
to make a conscious decision to grab my emotions by the throat and
control them. I wanted to be in control of
me. Simple as that. I would refuse to let anything
or anyone deter me from that basic goal. It has worked, but
every day is a new struggle to accomplish it. But once it has
been done, the confidence is there that helps you do it over and
over again. It never goes away,
this quiet panic that most traders live
with. You just learn how to control
it. Do this one thing and it will be easier to gain
the success you crave.
Trading Tip:
How Did They Do That
by
Frank Del Casino
Every day traders are posting
fantastic charts on the http://www.dacharts.com/ web
site. Some of these informative charts were created with
the tools, studies, markers and alerts available in Ensign
Windows. Take a look at this chart template created by
Frank Del Casino (nickname Discovery) with help from others in the
B-Line chat room.
So what does this chart show and how did Frank do
that?
Weekly & Monthly: On the left
side of the chart are support and resistance levels based on the
prior week's High, Low and Close and the prior month's High, Low and
Close. Support and resistance levels are standard
formulas based on three prices.
Section Panels: Below the chart are 5
panels showing various key values. The first section in gray
is showing the High/Low range of the opening 60 minute time
period. These two levels are marked on the chart with the H
and L letters.
The 2nd section in blue is showing Today's Open price
and Yesterday's Close price. Today's Open price is shown with
a thick black horizontal line.
The 3rd section in lighter blue is showing the Weekly
Pivot, Weekly High, and Weekly Low prices for the prior week.
The pivot price is the average of the High, Low and
Close. Example:
(1178.00+1164.25+1174.75) / 3 = 1172.33
The 4th section in purple is showing the Monthly
Pivot, Monthly High, and Monthly Low prices for the prior month.
The 5th section in yellow is showing Yesterday's Upper
Value Area price, Point of Control, and Lower Value Area
price. These values are obtained from a price histogram study.
Support & Resistance: S&R lines
for today based on the opening 60 minute range are being plotted as
the white, blue, green and red stair-stepped lines.
Click this link for information on setting up these Dynamic
Support and Resistance lines.
Daily Prices: A Daily Price Lines tool is
showing horizontal lines at key levels such as YH = Yesterday's
High, P = Yesterday's Pivot, YL = Yesterday's Low, H = Today's High,
and L = Today's Low.
A workspace and a template for this set-up can be downloaded from
the Ensign web site using the Internet Services form.
The workspace file is named Discovery and the template file is
named Discovery.
The workspace will open Weekly, Monthly, 30-minute, and 3-minute
charts. The charts need to be refreshed.
The price
histogram study on the 30-minute chart stores its values in global
variables so they are available for use with other charts. If
you want to read 30 minute histogram values on volume charts, copy
the Design Your Own (DYO) study from the histogram template to
another tab in DYO. Then open a volume chart and add a
DYO from those tabs to that chart. Refresh the histogram
chart, then refresh the volume chart. The histogram UVA,
POC, and LVA values should be there. Alter section or line
styles to your taste.
Once set up, you can save a Weekly
template, Monthly template, and a Histogram template from those 3
charts. Also save a template from the master chart which is
the chart where you read all values and have all the
lines. Then open those chart timeframes in any workspace
you want and apply the weekly, monthly and histogram templates you
saved. Finally, apply the master template you saved from
your volume chart or 3 minute chart to a time frame chart of your
choice. Refresh all charts, and it should then be in your
trading workspace. Save your
workspace. Make duplicate workspace somewhere.
All this would not be possible without the splendid powerful
tools Ensign Windows makes available to their subscribers.
To learn more about this type of a chart, and how the
various items shown are of value in trading, please go to the B-Line
chat room and join in the discussion. Hundreds of
traders patronize this chat room to talk shop, share ideas, discuss
methods, and help each other create charts like the one shown
above. If you need more information about the chat room,
click this link.
|