September 2006
Trading Tip:
Equi-Volume Bars![]()
by Ana
Maria Gallo
Copyright (c) 2006 AM Gallo
Ensign Software's
latest release introduces new features that are absolutely
delightful, particularly for the trader who appreciates and wants to
exploit the role volume plays in the market. This article focuses on
Howard Arrington's implementation of Equi-Volume,
but will touch on another key new feature, Bid/Ask
Volume.
Background
The
Equivolume concept was developed by Richard W. Arms, Jr., who in
1967 also developed another important contribution, the Arms Index
or TRIN, also a volume-based tool. Mr. Arms originally
calculated both TRIN and Equivolume, along with the companion Volume
Adjusted Moving Average (VAMA) and Ease of
Movement, using slide rules and later, calculators. What a
treat it is for the modern trader to simply right click and within a
few strokes, apply these concepts to any chart, any time frame.
Please see the Resources at the end of the article for further
reading on how Mr. Arms applies his ideas.
Equivolume Overview
Put in
its most simple terms, a box is drawn with the high and low as top
and bottom. The width of the box is determined by the volume traded
during that bar's time frame. From Mr. Arm's book Volume Cycles in the Stock
Market:
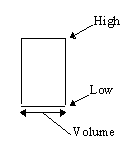
According to Mr. Arms,
"The shape of each Equivolume box provides a
picture of the supply and demand for the security during a
specific trading period. Short and wide boxes (heavy volume
accompanied with small changes in price) tend to occur at turning
points, while tall and narrow boxes (light volume accompanied with
large changes in price) are more likely to occur in established
trends."
For reference, here is an image showing Mr. Arm's graphical view
of Equivolume.
[image sources: armsinsider.com]
Ensign Software Equivolume Implementation
Ensign's implementation of Equivolume
is quite sophisticated and allows for a number of display and study
options. Each feature deserves elaboration so as to better
appreciate the possibilities. Here is a summary, followed by
examples showing how each feature can be used.
- The "X-Axis" is uniform, allowing trendline and cycle studies
not readily implemented with the classic display;
- Equivolume can be applied to all price displays: time, tick,
range, and volume, for which tick volume is substituted for trade
volume;
- Bars can be displayed as Equivolume Candles, allowing wick
information not visible with the classic box display;
and
- Bid/Ask Volume can be incorporated into the Equivolume display
and, using Ensign Flutes, reflect the classic "box" display.
X-Axis Uniformity
In the
Arms implementation, the "time axis" is time modulated by
volume. As such it is irregularly narrowed or widened by the
volume of the boxes. A clever feature in Mr. Arrington's
implementation is to center the candles, thus keeping a uniform
X-axis, and use visual overlap to display the variable widths. This
allows use of classic indicators and draw tools to be accurately
implemented. The amount of overlap
is user selectable, as is the net space between bars.
"Crowding" can be alleviated by increasing the space between
bars. The later is particularly useful to swing traders who
have time on their side when evaluating price action.
Time Frame Flexibility
The
advent of price display using range, tick, and volume has opened up
trading strategies geared to reveal areas of reversal or congestion
that traders can exploit. Because Volume represents commitment
at price, incorporating Equivolume display on range (or volume) bars
adds yet another dimension time-based volume flow may mask.
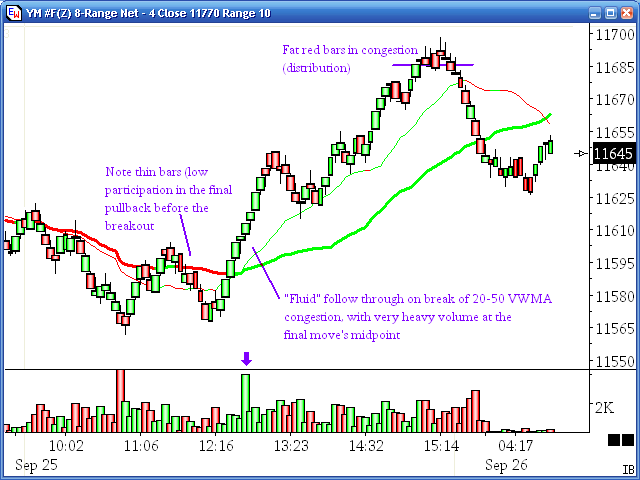
Nevertheless, the "read" is the same: fat bars show heavy
participation, thin bars indicate light participation.
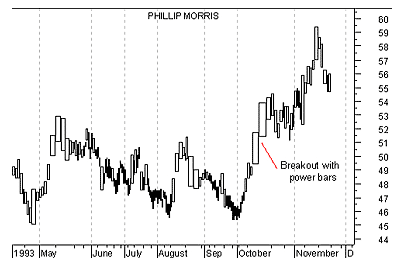
Range Bars
Range bars are formed as price moves through
the specified price increment, in the following example, 8 points.
When range bars overlap, price is congesting; fluid moves with
little overlap indicate buyers (or sellers) are enthusiastically
supporting movement.
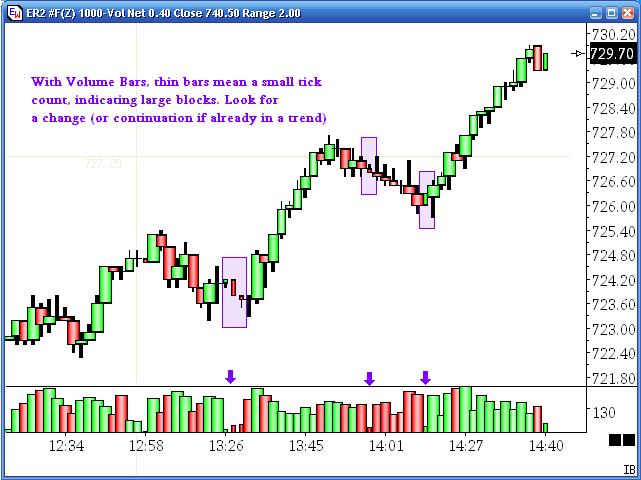
Volume Bars
Volume bars are exceptional in that when
displayed in the Equivolume style, they are somewhat
counterintuitive as tick count is the measure.
To clarify: A volume bar consists of a fixed number of
contracts traded, in this example, 1000 contracts. A tick may
consist of any number of contracts. So a 100-tick volume bar
of 1000 contracts represents an average of 10 contracts per tick
("small" traders). A 5-tick 1000-contract bar would be 200 contracts
average per tick (likely block trades).
Thus, a fat volume bar is composed of many ticks, ie, "smaller"
players; whereas a thin volume bar represents a few or even a single
tick of large volume, very likely block trades. This is one
visual "inversion" traders using Equivolume style on volume bar
charts must keep in mind.
Display Options:
Candle Bars
Shown below are "Ensign Rockets".
Equivolume is limited to the "body" of the candle, so that the tails
are still visible, providing additional sentiment information.
The bars have the "3D" option, which complement Equi-Volume very
nicely. Additionally, the lower volume panel displays
up/down volume with corresponding width properties. This is
particularly useful for reading doji (equal open/close) bars.
Although I refer to candles, Ensign's implementation also draws
Equi-Volume traditional bars and will even draw Line-on-Close
displays thicker and thinner.
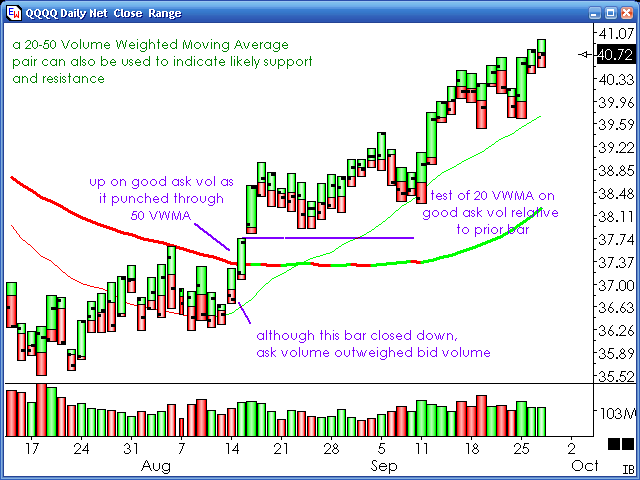
Flute Display
The Ensign "Flute" display best
approximates the original box style, but adds open and close hash
marks. For this example, I've used the Ask/Bid Volume coloring
option, where the "split" on each bar shows volume at the ask
(green) and bid (red). So not only do you see volume
participation, but also the bias in the volume is clearly
indicated.
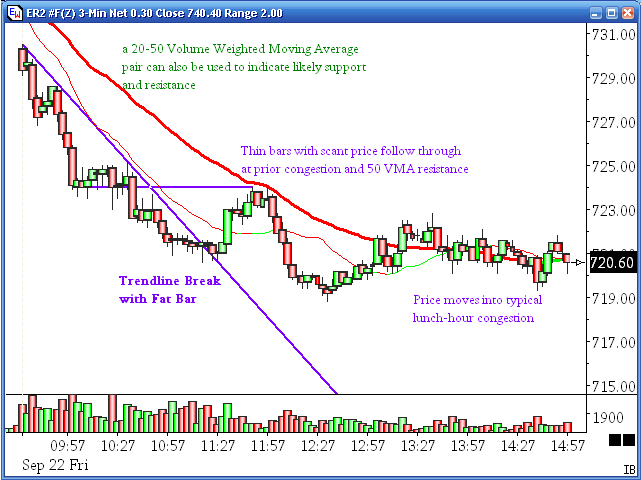
Note: The Ensign Volume Weighted Moving Average is not the
same as Richard Arms VAMA, but does a fine job nonetheless.
Summary
An important idea to keep in mind
is that Equivolume width is a primarily a visualization, not an
absolute, although, one could indeed make it an absolute and use it
in a formula, as Arms mentions in his book. However, our eyes are
capable of amazing discrimination without having to resort to a
number or calculation. That is why consistent use makes for
good experience in deciding if they are a tool for you.
Going a step further, I speculate that neither Arms or
Howard use any "secret" factor to weight each bar, but as I mention,
I wouldn't know. My own work with volume has repeatedly taught
me that any significant impact volume has on the
current price bar is highly relative to the immediately surrounding
volume, usually within a few bars, far more so than say, volume
bars even twenty bars back. So, if there is any "weighting" ,
it would be to "normalize" the maximum width relative to some number
of surrounding bars. As Equivolume is primarily a
visualization, this type of normalization would have small, if
any, impact on the quality of the representation.
The question then becomes, how do I know that this particular
"fat boy" or "Olive Oyl" bar is meaningful? Like with pitchfork, my
first answer is "by repeated study and personal experience through
often use." The second answer is that one can access volume
impacts by also using a higher time frame. Including more
bars in the speculated normalization would, in my opinion, dilute
the usability of the width, similar to the way a moving
average flattens the longer you make it.
So, to summarize, while my curious nature prefers to know the
innards of indicators, I'm less fussy about the why and far more
interested that what features are there are tailorable enough
for my trading needs. I'd say that as long as Equivolume
yields tradable signals, then I'll use them until they no longer do
so.
Resources
Trading with
Equivolume is a free PDF book provided by Richard Arms on his
ArmsInsider.com website. This little book is well worth your time if
you are not yet familiar with this charting technique.
Strategies he explores, generously accompanied by charts, are
turning points, breakouts, continuation, support and resistance, and
gaps. While his focus is on short term swing trading, my own
experience, as illustrated herein, show there is great potential for
intraday traders to incorporate Equivolume ideas into their trading.
Trading Without Fear (1996) Expands on Equivolume, which
Arms considers an indicator of fear and greed in the market, as well
as the companion indicators Ease of Movement and Volume Adjusted
Moving Average (VAMA), that can take into account float and total
shares for stock trading.
Profits In Volume: Equivolume Charting (1999)
Richard Arms' original work on Equivolume.
Related Volume Topics on Ensign's web site: (click on a
link to read the article)
|