November 2006
Trading Tip:
Larry at the Expo![]()
by Howard Arrington
The material for this article is from the seminar presentation by
Larry Pesavento, given Nov. 18th in Las Vegas at the Traders Expo on
the methodology he uses in his trading. I have extracted
the text from a video tape I made of his presentation. The
text has been edited to summarize the principles being taught in the
seminar. I also created my own examples for this article that
mimic the charts shown in Larry's Power Point presentation.
 |
Bias:
Take money out of the equation and you will trade a lot
better. I have always said I would be almost infallible
as a trader if you would take off the price, the time, and the
name of any chart I was looking at, so I would not know if I
was trading wheat, the Euro, the S&P, or IBM or
Google. Because then I would have no bias at
all. Because I have been doing this for 43 years, I have
biases, and I have to fight those all the time. Usually
that is when I get into trouble, when I fight them, and so I
do a lot of psychological work to try to get around them.
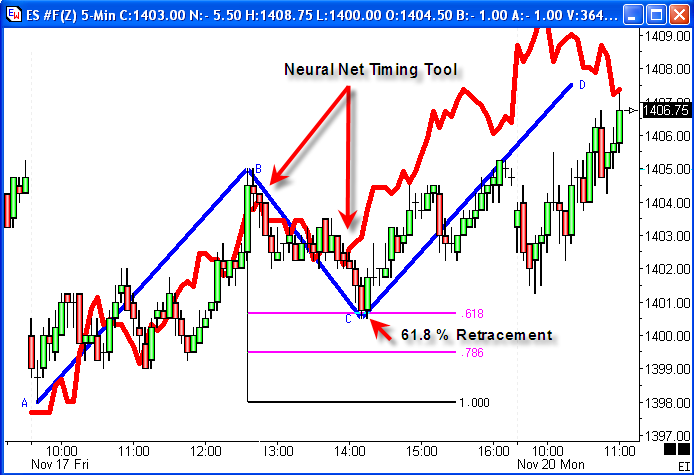
AB=CD:
This is an uptrend. You have higher tops and higher
bottoms. What we are trying to do with a forecast tool
is to find these spots (there a trend line meets a channel
line.) |
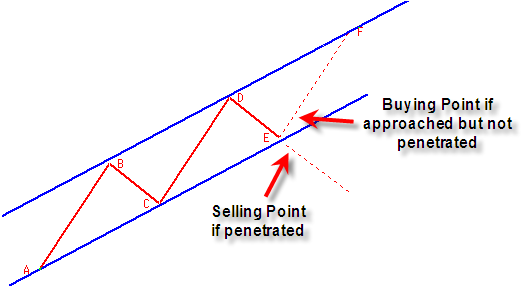
Point C might be a 61.8% retracement of the AB move, and CD might
be a 1.618 expansion of the BC move. We are trying to take
these ratios of 0.618, 0.786, 1.272 and 1.618 and find
the point in time where we are expecting a turn, match the price to
it, put the trade on and see how it works. A tool I use
often is the AB = CD tool. I am looking for the CD leg
of the move to be equal to the AB leg of the move. The
BC wave will be a retracement that is around 61.8 percent of the AB
leg. Here is an example.
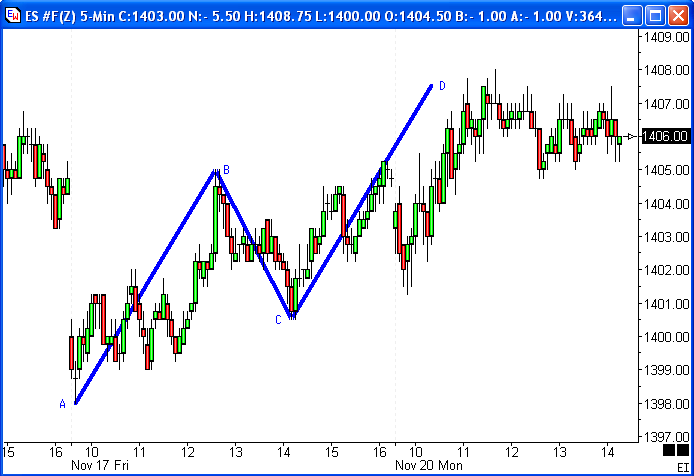
Neural Net Timing:
I use the Neural Net timing tool to tell me when to
expect a change in trend, as in this example at Point C.
I look for a retracement to the 61.8% price level and put on the
long trade at Point C. The Neural Net is showing a high
probability that the market will continue to rise the rest of the
afternoon, which it does in this example.
Even if you did not keep this trade overnight to get
to Point D, you still had a small profit buying at Point C and then
closing out near the end of the day. We are trying to find
those points where the market is getting ready to trend and you have
a nice Fibonacci number to buy off of. It is that
simple. You do not have to have any oscillators, MACDs, moving
averages, or any of those things to make it complicated.
Oscillators are lagging indicators based on things in the
past. With pattern recognition, we are talking about things
that occur in the future. We are looking to Point D for our
trade. Now we are going to be wrong some of the time.
Pesavento Patterns:
(Larry then showed a chart with just a zig-zag
line). You should learn to do a chart like this. I
am going to overlay the Fibonacci numbers on the swings of the
chart. I use the Pesavento Patterns tool to label the swings,
like this example.
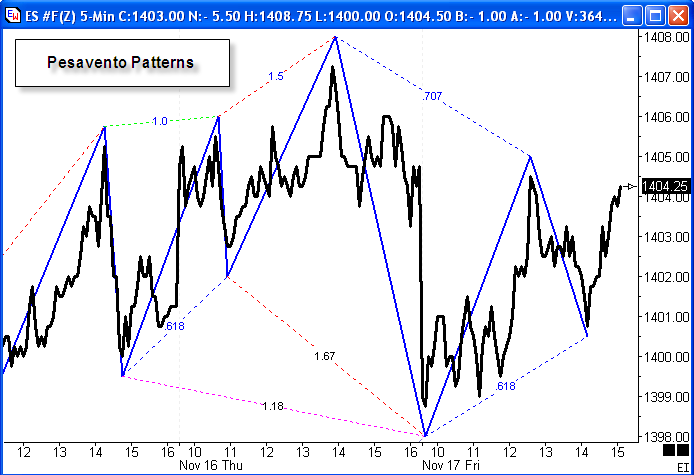
Look for the Fibonacci numbers given
earlier. You will learn to spot the AB=CD
relationships. In a downtrend, we want to sell into
rallies. In an uptrend, we want to buy on
retracements. Use the Neural Net timing tool to find
places where it is showing the time for a bottom or the time for a
top, and trade at the Fibonacci price levels.
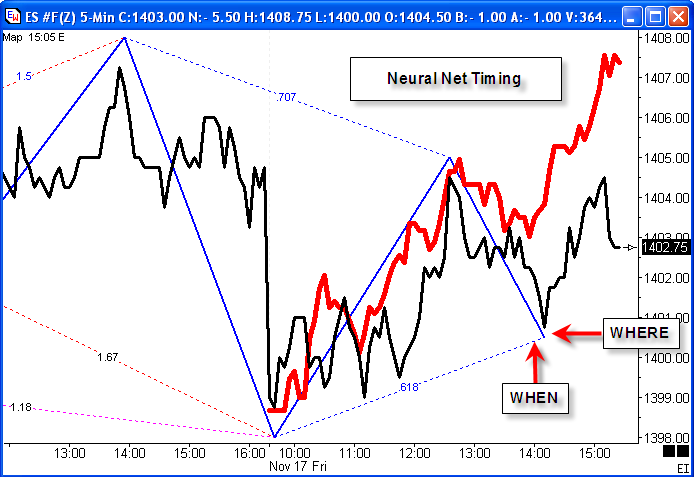
We are trying to match the price with the time, which
is an unusual concept because most people do not have TIME in the
future. The Neural Net curve is going out one day into
the future and showing with a high probability when the market is
going to turn. I wish we had a chance to show live
trading in today's seminar because you probably would not believe it
when you see it for the first time.
Do I make money every day? No, I do not make
money every day. But I make more money than I lose. I
have more profitable days than losing days. When I do lose, it
is because I misinterpreted what I am looking at, or the Neural Net
is totally wrong.
When you are ready to do a chart for the next day,
this is the type of analysis that you want to do. You want to
mark all the relationships on the chart that you can see. Put
on the Pesavento Patterns so you see all of the Fibonacci
percentages. You will start to see the bigger patterns of the
AB=CD. The numbers you are watching are the 0.618, 0.786,
1.272, and 1.618. Any time you are getting ready for an
expansion swing that is occurring into a forecast High, and the
current contraction swing is arriving at a 0.618 or 0.786, that is
when you are looking to be a buyer.
Now I can't show you everything in just one
hour. If you have interest in these types of patterns, begin
by learning to mark up a chart with the swing relationships like the
Pesavento Patterns. That you can get right out of my book
(Fibonacci Ratios with Pattern Recognition). That is real easy
to do. But it is going to take you awhile to do it. I
have spent 15 years trying to find this, because I did not know
what 1.272 was until 1986 and I had already been trading for 25
years. So it was a real revelation when I found 1.272.
Then when I found 0.786 a little later. That was when I wrote
the book, and it was named 'Book of the Year' in 1997. And, it
has been pretty popular ever since.
What you are trying to do is find the particular times
for the turns, and the prices for those turns will be at a Fibonacci
relationship. Every day when I walk in, I have a place where I
want to be a buyer and a place where I want to be a seller in the 10
major things I want to trade. I wait for the Neural Net tool
to tell me when the time is right. Then I look to see if the
price is right where I want to buy it. Of those 10
market, I will probably have 4 or 5 orders to execute, and I might
only get filled on 3. I might miss the other 2 orders by
just a little bit.
Human Nature:
(Audience question: What is the time frame of
the charts? Are these daily charts?) This
particular chart happens to be a 5-minute chart. The
principles work on basically any chart. If you took off the
time scale and the price scale, no one could tell which chart it
was. The charts basically look all alike. They have to
because we are all human beings, right? Do you know why you
lose trading? Because you are a human being and you want
to avoid pain. So when you are watching the monitor, you are
focusing on the up ticks when you are long and the down ticks when
you are short. If you would stop looking at the monitor and
just follow your trading plan you would be better off. If you
put a limit order in and put an alert on so it will either stop you
out or alert you at your first price objective, then go back and
look at it. I look at the markets early in the morning for
about a half hour just to see how close I am to what I
expected. Then I don't watch it. I do other
things. If it gets to my price it will beep, and then I will
look at it. Isn't that an easier way to trade than to sit
there all day long and agonize over everything that you are
doing? Agonizing is not trading.
When you see these young kids in a trading room, with
400 to 500 in the room, go back 6 months later and there will be a
whole new group of young traders. Because very few people get
this right when they do it. The statistics of people making
money in this business, 90% of first time traders are going to
lose. Why? They don't know what they are doing.
Now the person that stays with it over 3 or 4 years, is going to
learn the rules and develop a trading methodology. You are
looking at someone who is very biased about what I do because I have
been doing this pattern recognition stuff for a very long
time. I have not found anything that works any better. I
have a pretty good idea there will be a top right there.
(Larry points to a point in the future on the chart which completes
an AB=CD pattern at a 1.272 ratio at a Neural Net timing
point.) I am not waiting for an oscillator or anything
to go. Now I have a Neural Net tool that gives me the timing
of when to enter the market.
Complexity:
(Audience question: How you keep yourself from
adding more to your methodology? Are you continually
learning and trying new things?) I learn something all the
time. All I have to do to learn anything is just call
Howard. He will teach me something because he knows a lot more
about this stuff than I do. My stuff that I do is really
simple. And I don't understand computers very well. I am
totally computer paranoid. I literally panic, so I keep it
really simple. I haven't done anything different than what I
have been doing for so many years. I have looked at other
things, but I just don't do anything different. I see these
same retracement patterns every day, and then I use the Neural Net
tool to try to give me my timing. I try to be right 3 days a
week, break even 1 day a week, and I'll lose 1 day a
week.
My biggest problem that I have is because I am a
strategist for a hedge fund, and I have to give predictions of where
I think things are going to go in seven or eight weeks, like when
crude oil was topping out. I got that one right. And I
have to make an opinion, and I have to realize that my opinions are
wrong a lot. So I have to protect myself against myself.
Usually if you are in something 3 or 4 periods (bars) and it is not
working out you will be wrong. Usually this stuff works out
right away, I mean almost instantaneously, within 20 to 30
minutes. If you are not profitable after 20 or 30 minutes then
there is probably something wrong, and you should get out of it and
look at something else.
Christmas Present:
I'll give you a Christmas present. If you are
really interested in trading, buy Mark Douglas's book 'Trading in
the Zone'. Its a $25 book. If you will read that
book and then reread 3 pages a day for the rest of your trading
life, you will do great. What the book will do is teach you
that you know nothing about the markets and that it is not necessary
to know everything about the markets. You will learn that it
is about probabilities. Even though this is a trade, it is
just 1 trade out of a hundred trades. As soon as you lose you
have to go right into your next trade and follow your trading
plan. The only thing that prevents me from making money would
be if I were sick or they close the markets. That's the only
way I am not going to make money. I will sit there all day
long and trade live in front of audiences. That's the fun part
when you are at a show and can show people in real-time what this is
doing.
The Ensign Windows program has a playback system where
you can actually go back in time and pull up some charts and update
them as if they were live, and that's fun to do too. But in
one hour today I can't do this. What I am trying to do in this
hour is show you what the AB=CD formation is, hopefully you will
look at the four Fibonacci levels we talked about, and maybe even
take a look at the Neural Net timing tool. If you are trading
currencies and take a look at this, you will not trade without
it. It will get you hooked because it is a real edge in the
markets that you have never seen before. But it is not
infallible. It is only a probability and it is only a
tool. There is nothing incredibly mysterious about it.
It is just mathematics and looking at patterns. These numbers
are in the market everyday and that is why they repeat so much and
gives you an edge. But most people do not do this type of
work.
Repetition:
I walked through the Expo hall yesterday watching all
the exhibitors showing their charts with oscillators.
There was nobody doing this kind of thing. They use some
Support and Resistance, but no one was looking at all the patterns
and how they relate. Once you see how this swing repeats again
here, here and here, you see this basic vibration in the market
repeats over and over again. That is all the markets are
ever doing, repeating over and over again. It only goes up,
down or sideways. It is not the hardest thing in the
world.
My little daughter when she was about six, we would
get Commodity Perspective every Saturday morning by special delivery
because we did not have computers back then. I would get my
charts on Saturday morning and she would help me draw the
lines. I would let her mark up charts like cocoa and coffee
which I did not trade. I would ask her which direction the
market was going. She would look at the chart and say, this
one is going up, or this one is going down. If the market was
going sideways she would put her thumb in her mouth and shake her
head. That is what most of us do anyway when we don't
know what the market is doing.
(Audience question: What is your daughter doing
now?) She is a doctor in Denver, Colorado.
(Larry then showed several examples of the Neural Net
curve for the next day, and then added the bars to the chart so the
Neural Net curve and the bars could be compared.
Correlation was high, but not perfect. Some examples were
shown where the Neural Net curve had a better fit when plotted
inverted on the chart. Please read my 2002 Trading Tips
article about Neural
Networks.)
Always Use Stops:
The Neural Nets do not work this well all the
time. That is why you have to use stops. Let me tell you
about my personal trading. Whenever I put a trade on, 2 things
happen. I don't use electronic trading and I know you are not
going to believe it, but I still pick up the phone and call an order
desk. I tried a couple of electronic trades and I screwed them
both up. So I am still picking up the phone can calling my
broker. I am probably one of twelve people who still do
that. My broker will not take the order if I do not give the
corresponding stop loss order. The two reasons why you lose in
this business is that you put your stop too close because you don't
know what is going on, and the second thing is you don't put a stop
in immediately. If you don't put a stop in when you place the
trade or shortly thereafter, just send the check directly to
me. Then you won't have to worry about commissions you pay to
your broker. You have no chance if you don't protect
yourself. You don't know what is going to happen next.
Even with the Neural Nets you do not know what is going to happen
next with 100% certainty. No one knows that.
(Larry then showed a Swiss currency chart where the
Neural Net correlation was high for the first few hours of the day,
and then the currency broke down when the Neural Net curve was
turning higher. This was a good example where having a stop
was necessary. The Neural Net curve ascended the balance of
the day and the actual market went sideways.)
Face Value:
Currencies are the best thing to trade because you are
trading the most pure thing in the world. There is no supply
and demand to worry about. It is just people moving
money. That is all it is. You do have to worry about
when people talk about the money, though. People like George
Saros use the markets to manipulate their position. You might
find that hard to believe, but it is true.
Do you folks know what my educational background
is? I have a Masters degree from Harvard, a Doctors of
Jurisprudence from Yale, and I worked for Chief Justice Burger for 2
years before I became a Navy Seal, and I won the Congressional Medal
of Honor twice. (Audience chuckles) Now what I just did
to you is what CNBC does to you each day. They sit there and
lie to you. (Audience laughs) Well, they do. No,
its true. They are passing on to you all this information they
are getting from these self-serving sources. After a while you
would think they would get the picture they are feeding them this
stuff.
When I worked at Drexel, which is no longer in
existence because of Mike Milken, they used to have stock broker
meetings on Monday mornings and they would have portfolios of stocks
that Rothschild who owned Drexel was trying to get rid of, and the
joke was put lipstick on this thing and get rid of it. And
that is what the brokers tried to do. That was back in the
70s. Now you buy something and it goes up forever. Back
in those days it was difficult to be a stock broker. You have
to be real careful when anybody tries to tell you something.
Exceptional Timing Tool:
(Larry then went through several additional chart
examples that illustrated the Neural Net timing. Most of
his examples were using 2-minute bars. The Neural Net curves
are available Monday through Friday for the hours of 8:30 a.m. to
3:00 p.m. Eastern time. Creation of a Neural Net curve
for a 24-hour day is a project that has not yet been accomplished,
but might come to pass.)
In my Friday seminar, the Neural Net curves were so
exceptional, I had to separate the bars from the curve so you see
what the market was actually doing. One lady said I know you
are pulling my leg so she got up and left. The Euro on Friday
actually was so perfect that it tracked all of this. There
were little swings and the correlation was nearly perfect.
When you get days like that you walk out wishing it could be like
that every day. But, unfortunately, it is not.
(Audience question: In nearly every chart you
have shown, why does the correlation at the beginning of the day
look better than the last couple hours of the day?) Yes,
the last hour of the day you will have less correlation. The
reason why is because you have gone through several hundred 2-minute
bars towards the end of the day, and so the correlation is
less. But we have tested it early in the day, tested in
the middle and tested it towards the end of the day. It
doesn't make any difference. Once the probability curve is
made for the whole day it is not going to change very much.
(Audience question: What do you base the day
upon for a currency pair?) We use the opening time for the
Chicago Merc opening time because that is how my research got it
started. Back in 1990, there wasn't any Forex currencies to
trade. Initial tests were done on the Merc products for the
pit traded currencies. Beginning of the day refers to 8:30
a.m. Eastern zone time for all currency pairs for the Neural Net
curves. The curves go through 3:00 p.m. Eastern
time.
(Audience question: Does the Neural Net work
better with one currency than another?) No, any 2-minute chart
you want to look at, whether it Gold, S&P, soybeans, or Google,
doesn't make any difference. It is a probability based
thing. It is going to work some of the time and lose some of
the time. It gives you a probability of being right more than
it is wrong. In my personal trading, I am close to being right
70% of the time. I want to be in markets where they are
playing big with lots of volume and volatility. It is not
going to work on thinly traded stocks, IPOs, or stuff like
that. You want volatility. You want liquidity. And that
is what Forex offers you.
You have really great risk control. You can view
things overnight. When you wake up you can put a trade on and
be out of it by the end of the day. That is an ideal situation
without risking very much. My problems as a trader when I have
to make an investment decision for the hedge fund, when crude oil
was making highs up there during the fighting between Israel and
Lebanon, all the things I was looking at, how was I saying oil is
not going to make $80? $78 was it. I agonized for
months. Every day they would call me and say why is it not
breaking? I said, 'When it gets above $80, call me. I
don't know when it is going to break.' Now it is $56 and they
want to know where it is going next. I don't know. All I
can tell you is that was the top. $55 may be the bottom but I
am not sure.
Trade of the Year:
I do a trade of the year every year. I have been
doing it for many years and some of my trades in the past have been
buying crude oil at $11, buying gold at $2.50, selling Treasury
bonds when they were selling at $127, buying the Nikkei Dow when it
was at 7000. Out of the last nine years I have had 7 winners
and 2 break evens. And this year, I hate to say this, I have a
very, very strong negative bias towards the stock market. If I
could stand up on a chair, I would yell and scream at you, but it
probably would not make any difference. But I see very bearish
connotations.
If the INDU goes below 11,500, which is about 700
points from where it is right now, you have a chance to lose a lot
of money if you are in the stock market. The reason behind
this would take me 2 hours to go through. The patterns are
there just like we were in the year 1999 and 2000. Very, very
negative. Whether it works or not, I don't know. Believe
me, I know nothing about fundamentals. I never read a
newspaper. I don't listen to television. This is all
about what is on that bar chart. That is all I know.
(Audience question: How strong was your opinion
back in 2000?) If you want to know, it was in this meeting in
San Francisco, March 24th a Saturday, and I had 400 people in the
room and the markets had been going straight up. People were
walking into the room with their equity runs of how much every one
was making. I was standing on a small podium, and I was
showing them all these patterns, the Butterflys and Gartleys.
Everything was so bearish, much like it is now. But it seems
worse now because we have divergences. The NASDAQ is not even
38% retracement from the high in 2000, and most of the stocks that
were popular then like JNPR and CMGI, these stocks used to be $200
and $300 stocks and now they are nothing.
And I got up on my small podium, and I yelled and
screamed at them. I had 400 people in the room and I said if
the NASDAQ goes below the low of last week, get out of all your
stocks. All you are risking is if it goes back above the high
you can buy them back. At least protect yourself. That
week, Business Week, U.S. News and World Report and TIME magazine
had the same cover of a bull, one with NASDAQ 5000, Dow Jones
15000, and the other with something about the NASDAQ going to
the moon.
On November 6th, 2006, on Barron's front page was the
DOW 13000. The Dow has a very poor track record. You
don't ever want to get your picture on the front of TIME
magazine. That is not good. That is usually when it is
over. It is really not a very good thing. One
person out of 400 people called me to thank me for getting him out
of the market. And as you know, the NASDAQ has dropped
85%.
(Audience question: Do you feel that same way
now?) I feel more so now because we have so much
divergence. The Transports, and the NASDAQ have
divergence. We do not have the euphoria like back then, but we
have euphoria in other markets like the bonds and in real-estate
market. People do not realize how badly they can get hurt in
real-estate. But they will learn.
If you bought a house in Beverly Hills in 1929, you
had to hold that house 36 years before it got back to
even. I am not saying things will be as bad as
1929. When you see a piece of real-estate in New York that is
1200 square feet going for 2.3 million dollars, you know something
is not right here.
(Audience question: What is your prediction for
the Dollar?) I do not like to make predictions like
that. I give a 'Trade of the Year' based on patterns. If
the Dollar goes below 83, and it is at 85 now, there is a chance the
Dollar could melt down. That won't be good for anything.
It hasn't rallied very much, and if it breaks really hard, and the
Euro gets above 130, the Euro could go to 150., the Pound could go
to 2.50. Remember, the Pound used to be $7, so a lot of these
things could still move.
(Audience question: If the markets break down,
will Gold go to $1000?) They are totally different
markets. I know you believe that the man who makes the rules,
rules the Gold. Each market is different. I do not look
at inter-market relationships. I do watch for relationships
among the currencies. But gold investors are different than
stock investors. A gold investor is always a gloom and
doomer. He is always looking for the end of the world, and
always has a little bit of paranoia. But remember a paranoid
person only has to be right once. (Audience
laughs)
Bar Chart Tells It All
All I do is just look at the patterns. I don't
do anything else, don't look at fundamentals, or watch the Federal
Reserve. None of that stuff. My Masters degree is in
Business and my BS degree is in Pharmacy. I don't know
anything other than what is on those bar charts. I believe the
sum total of all buyers and sellers is in the bar chart. They
can lie to you, right?, like Enron. They can cheat you
like K-Mart, Wal-Mart and some of the others, but they can't hide
from you. If prices are going up there are more buyers, and if
prices are coming down there are more sellers. That's all you
really have to know. Sometime between when Enron went from $95
to zero, it had to cross the 200 day moving average, didn't
it? And if anyone ever talks to you about trading a 200 day
moving average, don't walk away from them, run away from them.
That thing doesn't work. That is the biggest crock of
baloney. They have been using that for 60 years, and it still
doesn't work. That's just my opinion, however wrong it may
be.
(Audience question: How do you decide what price
to trade at?) When I look at a particular time, I want to also
look at the previous day and know support and resistance
points. If the market is moving down, I might wait for a rally
to then sell short. If it is not making a point I want to hit,
I might pass on the trade, or wait for a retracement move to get
in. More often then not, because it is based on patterns, you
are going to get a lot of places where the highs and lows are going
to come in at your numbers. It repeats over and over.
Just go back and look at old charts. Patterns repeat over and
over. Do you know what it is like to wake up in the morning
knowing you can beat the markets? It is a great feeling.
(Expo staff opens the door and announces 5 minutes
remaining.) Oh, thought that was a margin call.
(Audience laughs loudly) |