December 2006
Trading Tip:
Predictive Average![]()
by Howard Arrington
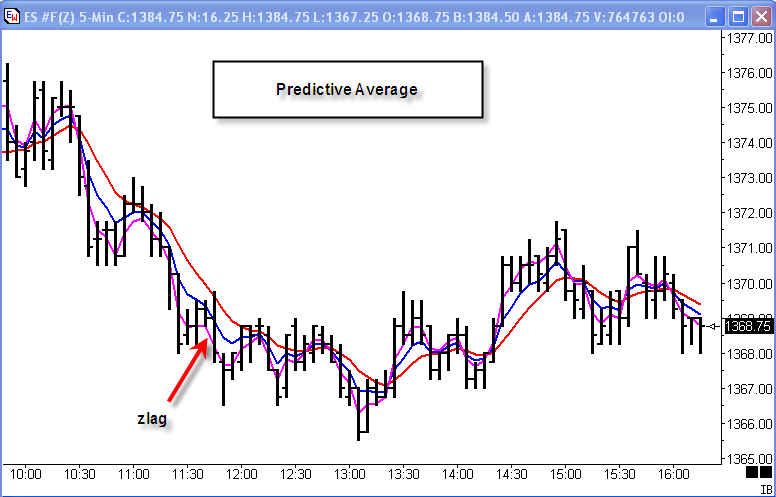
This Predictive Average is a clever method for removing some of
the lag inherent with moving averages. The principle involved
is to use the spread between two moving averages as an offset from
the original moving average. In this example, the
original moving average is the Blue line. The spread
distance between the Blue line and a 2nd moving average (Red
line) is added to the Blue line to create the Predictive
Average which is drawn in Pink.
Formula:
ave1=xaverage(price,period);
ave2=xaverage(ave1,period);
spread=(ave1-ave2);
zlag=(ave1+spread);
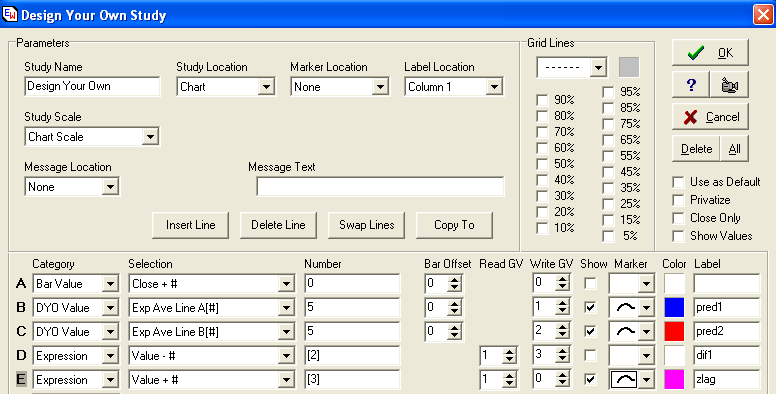
DYO Implementation:
Line A will be your price selection. Example uses the bar
closes, but could be changed to be a bar's High or Low. Line B
is the Exponential average of the data on Line A. Line C
is the average of the data on Line B. This is the calculation
for ave1 and ave2. The 1st average is stored in
GV[1]. The 2nd average is stored in GV[2]. GV
is our notation for a global variable of which there are 255
variables. Line D calculates the spread between the two
averages by subtracting GV[2] from GV[1].
Line D reads GV[1] for Value and subtracts the Number field which
is the contents of GV[2]. This result is written in GV[3] and
is the spread value. Line E reads the average from GV[1], adds
the contents of GV[3] which was written by Line D, and plots the sum
as a Pink line. This is the zlag expression.
This example can be downloaded from the Ensign web site using the
Internet Services form. The template for the example is
named: 1391-PredictiveAve
Template: 1391-PredictiveAve
Trading Tip:
Anticipating Moving Average Crossovers
by Howard Arrington
A significant feature in Ensign Windows is the PriceFinder(TM)
technology that can be used with any study. PriceFinder is a
selection in the Design Your Own(TM) study feature. It
can be used to solve for tomorrow's close and plot the price
that would cause two moving averages to cross.
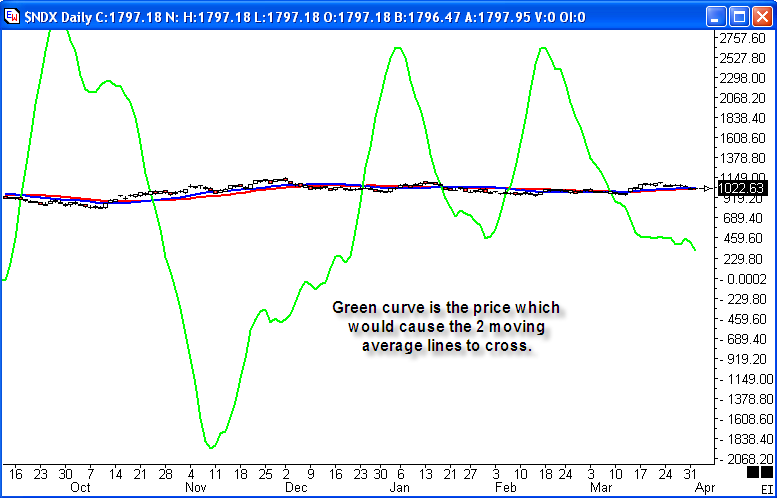
Figure A - Ensign Windows PriceFinder. The
blue line is a 20-day moving average, and the red line is a 30-day
moving average.
The green line was calculated using Ensign's PriceFinder.
This curve shows the price which would cause two moving averages to
cross. As the two averages get near each other, the green line
approaches the averages. The advantage and power of
PriceFinder, is that it can be used with any study. Go
to the file:///C:/EnsignSoftware/index.htm
web site for additional examples of PriceFinder being used with
Bollinger Bands, Commodity Channel Index, and Relative Strength
Index.
The creation of the crossover price curve required 2 lines in
Ensign's Design Your Own study, as shown below.
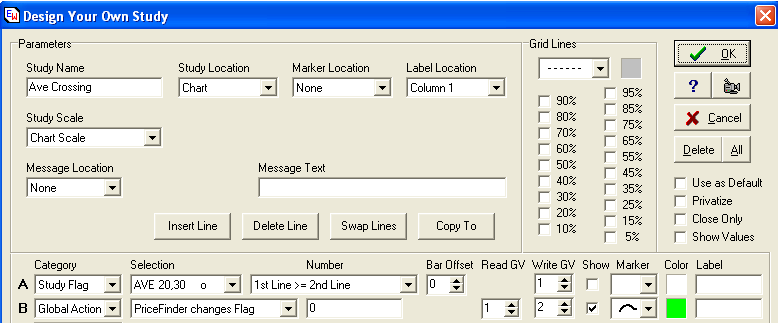
Figure B - Design Your Own parameters that
implement tomorrow's close (TC) curve.
The Line A selection is a Boolean flag for the Moving Average
lines, and will have a True value when the 1st line (20-bar average)
is above the 2nd line (30-bar average). Line B uses the
PriceFinder technology to calculate the next bar's close that would
cause the Boolean Flag from Line A to change states. This
price is plotted using a green curve line.
The following chart is the same chart shown in Figure A.
The scale has been changed to show more clearly the relationship of
the bars, the 2 moving average lines, and the price curve
that causes the 2 moving average lines to cross.
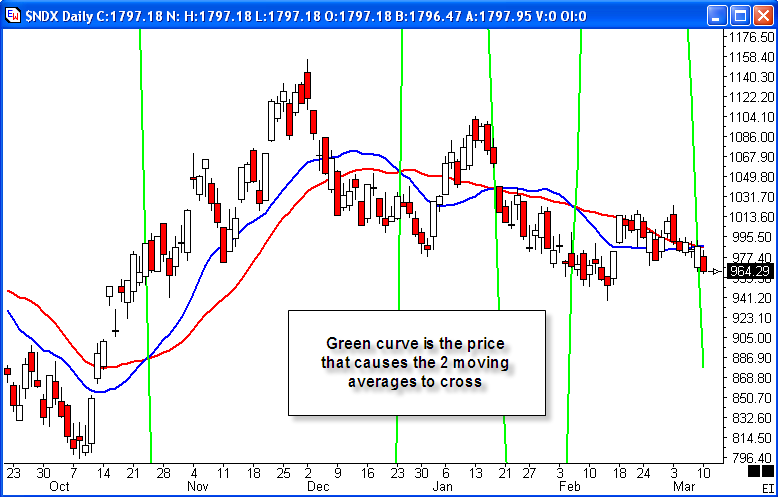
Figure C - Next bar's closing price that causes the 2
moving averages to cross.
When the blue line (20-bar average) is below the red line (30-bar
average), a higher price is needed to raise the blue line to cross
the red line. The green line is showing the price for
tomorrow that is needed to cause the 2 moving averages to
cross. Once the blue line is above the red line, the
next bar's price (green line) price would naturally be below
the two averages. A lower price is needed to cause the
blue line to descend to cross the red line.
Formulas for calculating the price that would cause 2 moving
averages to cross are published in the February 2007 issue of Stocks
and Commodities in the article 'Anticipating Moving Average
Crossovers' by Dimitris Tsokakis.
Trading Tip:
$TICK and $TICKI Divergence
by Howard Arrington
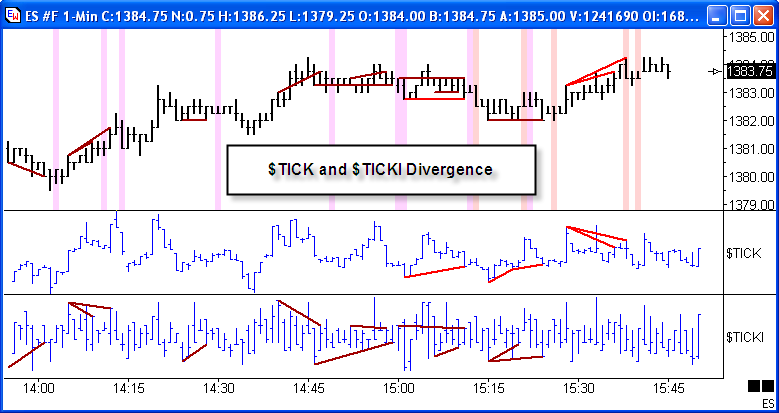
Ensign has a tool for showing Divergence between a
study or overlay and the host chart. In this example $TICK and
$TICKI are added to the ES #F e-mini chart as overlays.
The Divergence study is marking divergence formations between the
overlays and the ES #F chart.
Rarely will $TICK and $TICKI have divergence on the same
bar. You can study the example and decide what action you
might want to take when divergence is present. One
drawback to factor in is that the Flag for the Divergence on either
overlay will be 2 bars after the Divergence occurred.
This example can be downloaded as a template from the Ensign web
site using the Internet Services form. The template is
named: 1398-TickDiverge. In the
template's content note the use of a DYO to select the High or the
Low of the overlay for use in the Divergence calculation, so the
divergence lines are drawn from the Highs and/or Lows on the
overlays.
Template: 1398-TickDiverge
Trading Tip:
CCI Zero Line Pullback
by Howard
Arrington
What is a pullback? And how could it be found using the
Commodity Channel Index (CCI)?
Pullback usually is referring to a retracement wave in a
trend. With a CCI study, the price pullback causes the
CCI line to head towards the zero line, and typically reverse at the
zero line about the time the retracement
is complete. Patrons of CCI call this a 'zero line
bounce'.
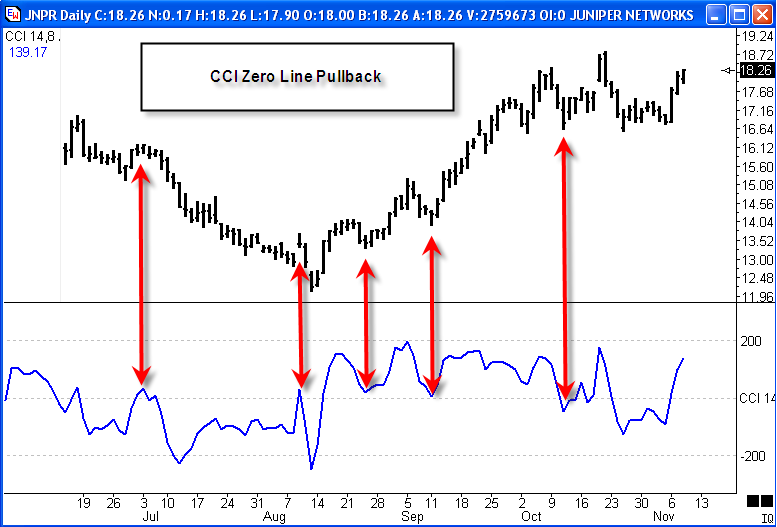
The first 2 arrows show pullbacks in a down trend, where the CCI
returned to the zero line and then the down trend continued.
The last 3 arrows show pullbacks in an up trend, where the CCI
returned to the zero line and then the up trend continued.
|