April 2007
Back Testing Tip:
Ensign Stochastic System
by Howard Arrington
In this article I will design a trading system based on the
Stochastic study using the Design Your Own (DYO) feature in Ensign
Windows. Let's begin by understanding the fundamental
behavior of Stochastic so that we can pick some rules for when to
enter and exit a position. Click this link for
additional reading on the Stochastic
Fundamental Behavior.
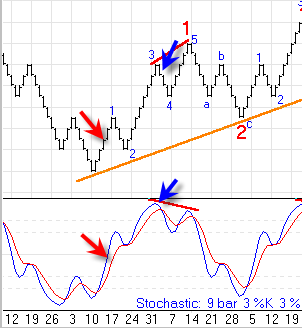
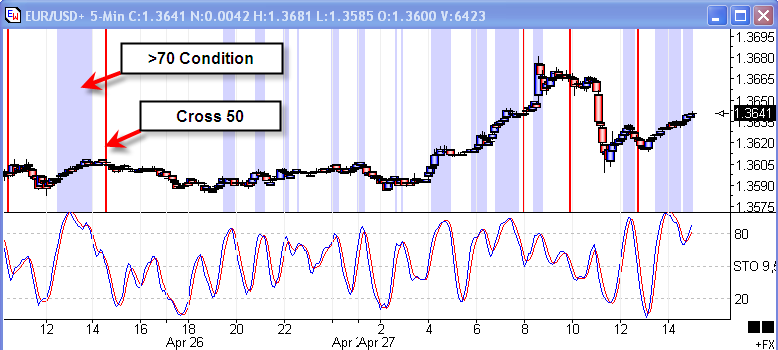
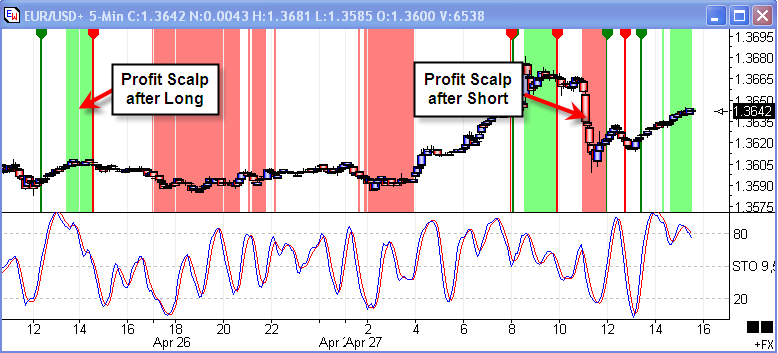
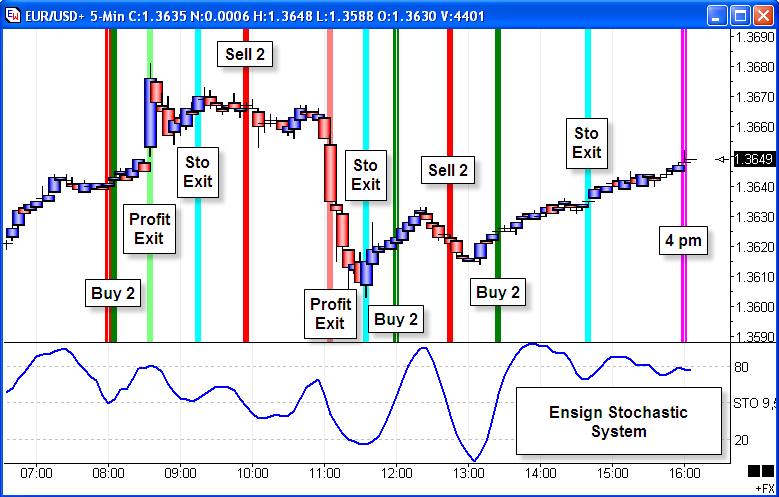
I want to catch a new trend when it starts, which has
been marked with the Red arrows on the chart. The Buy
Signal could be based on the Stochastic %K line crossing the 50%
level after having been below 30%. One of the exit
rules or objectives could be when the %K line turns down the 2nd
time, which is marked by the Blue arrows. This would typically
be at the end of a 3rd wave in the Elliott wave pattern.
So the portion of the chart I am trying to scalp is from the Red
arrow entry to the Blue arrow exit. The inverted pattern
would be the basis for the Sell Signal.
I would also like the system to try to scalp a trade
based on a profit objective. So I will design the system to do
a blend of both, and have rules for aborting the trade based on
either an adverse move or running out of time at the end of the day
session. Hopefully in a choppy market the 1st contract's
profit objective will put some money in the bank to offset small
losing trades, and in a trending market the 2nd contract held for
the 2nd Stochastic turn will make a nice profit for the system.
The following is an outline of the rules for the
Ensign Stochastic System. The design is based on trading
the EUR/USD forex symbol, but could be adapted to trading any
symbol, including the popular ES, ER2, NQ or YM futures symbols.
General Rules:
-
Trade signals between 7 a.m. and 3 p.m. Eastern Zone
time. That is when I am watching the markets.
-
Exit entire position (if any) at 4 p.m.
I do not want to carry positions over night.
-
Exit 1 contract on a profit objective of 10
pips. Test the system with larger and smaller
profit objectives.
Long Trade Rules:
-
The Buy Signal will be %K being below 30 and then
crossing above 50. Buy 2 contracts.
-
Exit entire position which may be 1 or 2 contracts
on the 2nd %K downturn. Location of the downturn does not
matter.
-
Exit entire Long position if %K crosses below
40. This is the bail out rule for being on the wrong
side of the move.
Short Trade Rules:
-
The Sell Signal will be %K being above 70 and then
crossing below 50. Sell 2 contracts.
-
Exit entire position which may be 1 or 2 contracts
on the 2nd %K upturn. Location of the upturn does not
matter.
-
Exit entire Short position if %K crosses above
60. This is the bail out rule for being on the wrong
side of the move.
Time Conditions:
Let's begin by taking each rule, one at a time, and
show its implementation using DYOs and Study Alerts in Ensign
Windows.
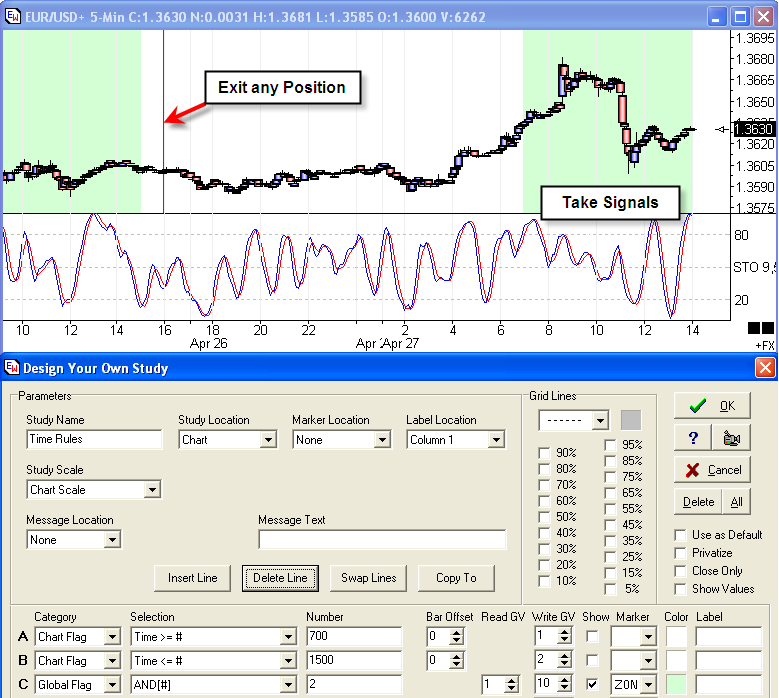
This DYO implements Boolean flags for the two rules
based on Time. Signals will only be taken between 7:00
and 15:00 EST which is marked on the chart with the green
background. This time condition will be stored as a flag
in Global Variable [10].
Long Signal:
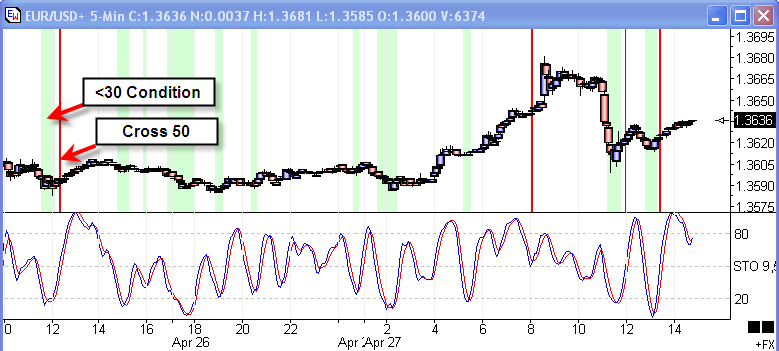
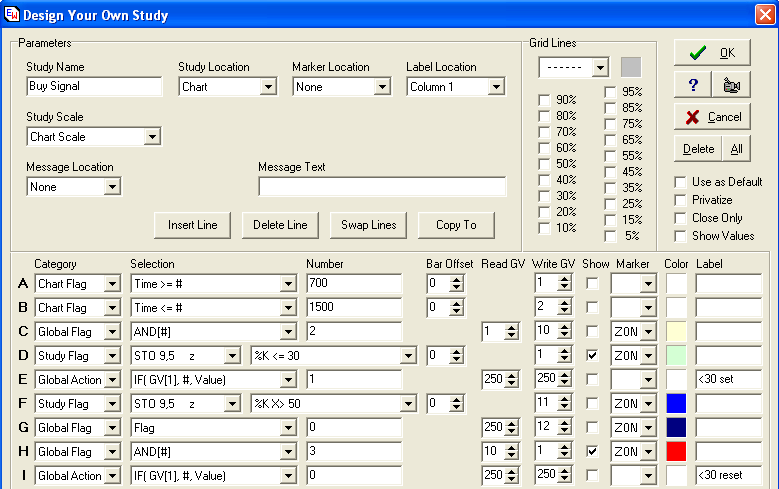
Line D tests whether the %K is less than 30.
When this condition is true, Line E sets a Flag in GV[250] to
remember the event. The private Global Variable [250] is used
to remember this event between calculate calls since this trade
system might be running on multiple charts simultaneously.
Line F is True when the %K crosses above the 50
level. Line G copies the Flag for the <30 event in
GV[250] to GV[12], so it can be included in the 3 flag test
performed by Line H. Line H is the Buy Signal to put on
a long position of 2 contracts. When Line H is True,
Line I will reset the flag in [250] which clears the Below 30
condition. This condition will have to set itself again by
having %K go below 30 again. This way the system has only one
Buy Signal (Red stripe) following any Below 30 Condition (Green
stripe).
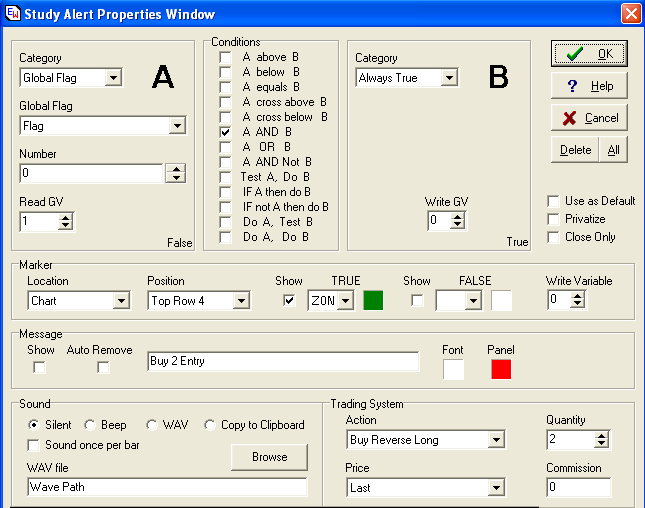
The following Study Alert will be used to execute the
trade system to Buy 2 contracts when the DYO Flag on Line H is
True. The Flag was saved in GV[1].
Sell Signal:
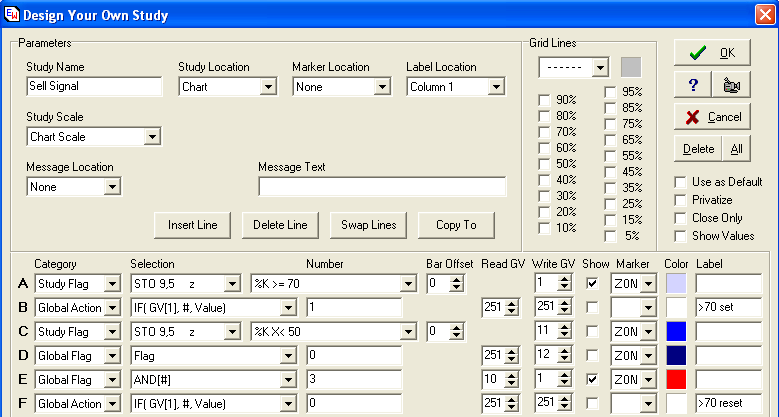
The logic for the Sell Signal is similar to the Buy
Signal logic. First the %K must be above 70 as indicated
by the blue stripes. Then it must cross below 50, and this
signal is marked by the Red stripe. The Above 70 condition
flag stores in GV[251] is reset by Line F so that a single
occurrence of the Sell Signal follows the Above 70 condition.
The Study Alert to sell 2 contracts when Line E is
true is similar to the one shown for the Buy Signals.
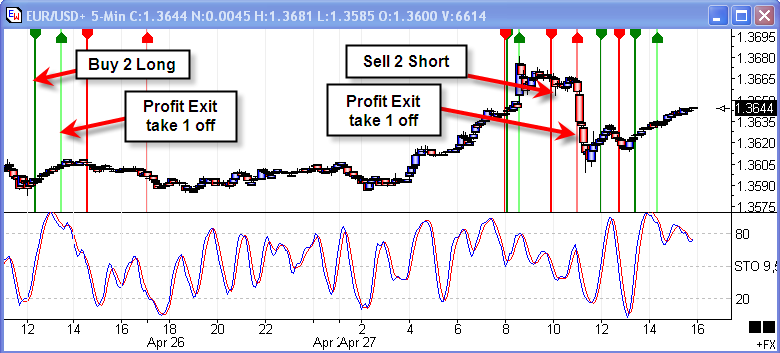
Profit Exit:
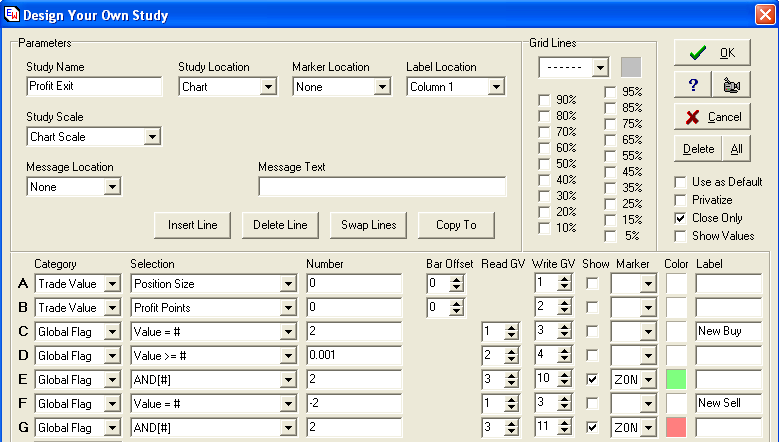
This DYO tests for a Profit scalp objective being
met. The DYO will only mark conditions where the
Position Size is either a 2 for a Long or -2 for a
Short. This means that the scalp to take off the 1st
contract has not happened yet. The scalp size in points
is the Number field on Line D. The DYO is putting green
stripes on the chart where the Position Size is 2 and the profit
exceeds 0.0010 points. The red stripes show where the position
is short 2 contracts (position size = -2) and the profit objective
of 0.0010 points has been met.
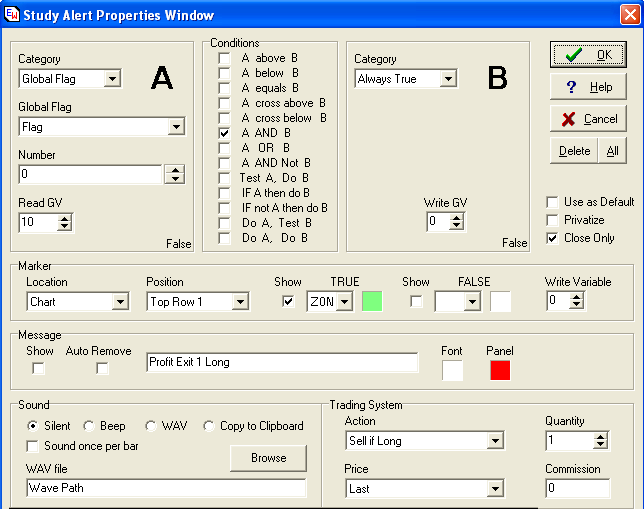
A True Flag on Lines E will be used to sell 1 of the
Long contracts. A True Flag on Line G will be used to
buy back one of the Short contracts.
This is one of 2 Study Alerts that see the DYO flags
and take 1 contract off on a Profit Exit. The Flag was stored
in GV[10] on Line E of the Profit Exit DYO.
Stochastic Exit:
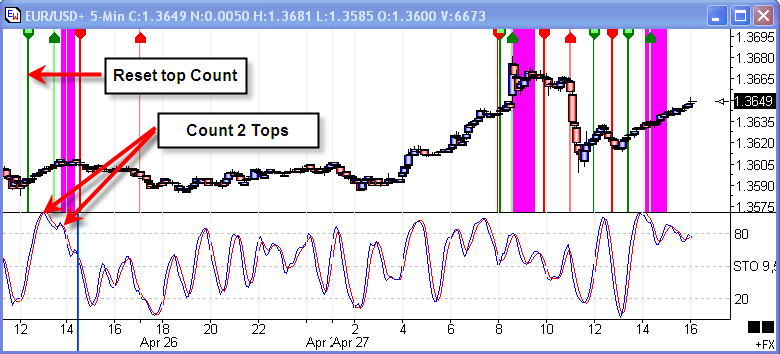
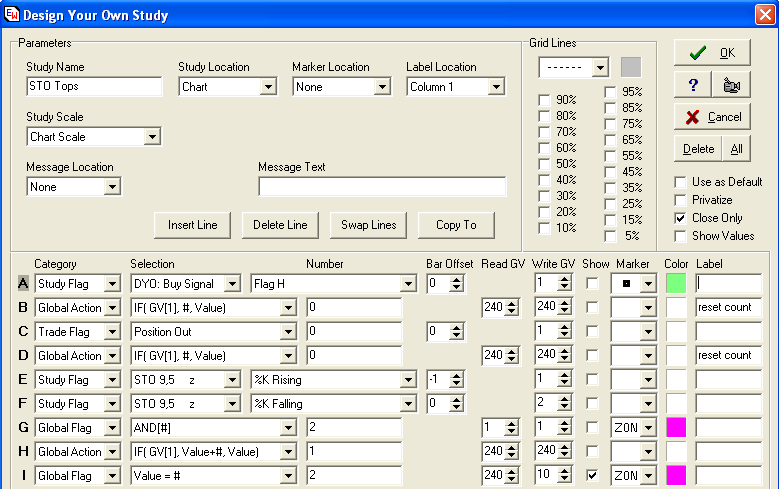
Line A and B will reset a private Global Variable in
[240] used to count the Stochastic %K tops when a Buy Signal is
seen. Line C and D will also reset this count when the
Trade Position is neutral.
Line E and F detect the top in the %K formation by
seeing a rising Stochastic on the prior bar and a falling Stochastic
on the current bar. When the top formation is detected, Line G
will increment the top counter in GV[240]. Line H will be True
when this count is a 2, and used to exit all positions.
Hopefully, the scalp objective was achieved ahead of this exit
signal, as was the case with the first Buy Signal on the left side
of the chart (dark green stripe) being followed by the light green
strip (profit exit).
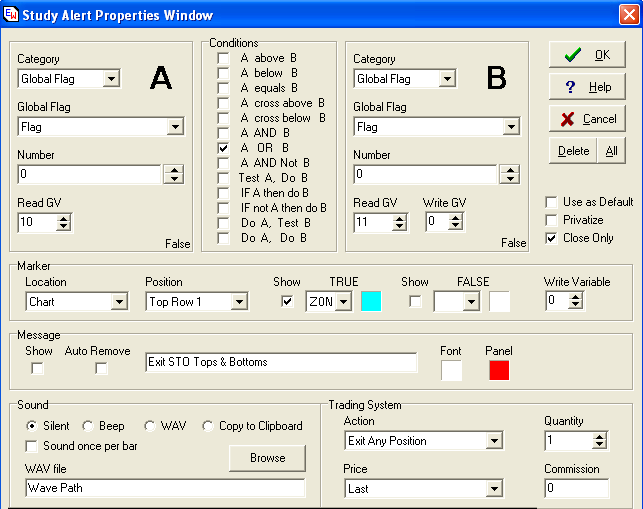
Here is an example of the Study Alert that watches the
DYO Flag for the 2nd Top/Bottom counter. The Flag for a
Stochastic Top Exit was stored in GV[10] and the Flag for a
Stochastic Bottom Exit was stored in GV[11]. Either
condition performs the action to Exit Any Position, so both Flags
can share this Study Alert.
Time Exit:
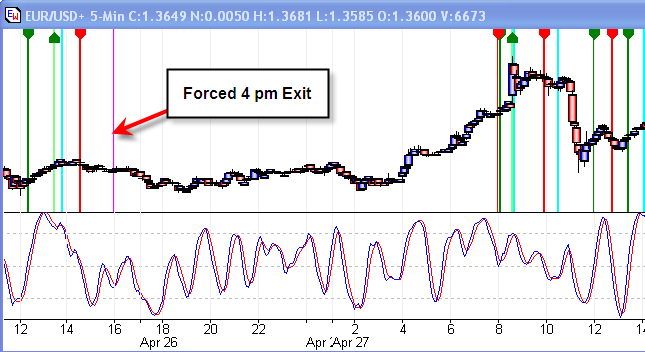
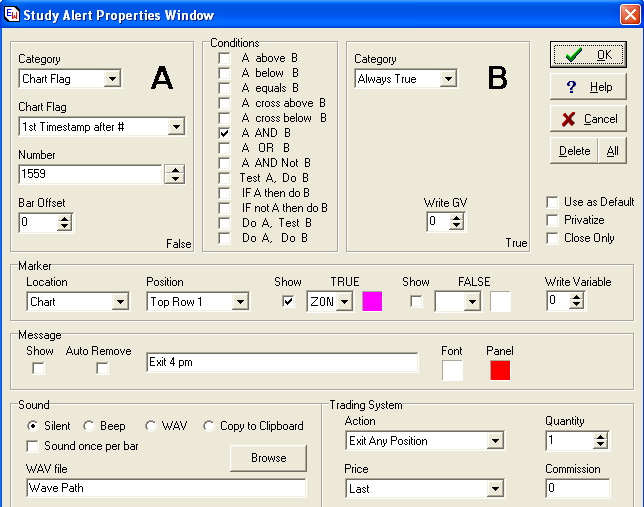
Panel A is True for the 1st bar after 1559 which is
shown on the chart as the vertical pink stripe. This is the
condition to exit any open position for the night.
Wrong Trend Exit:
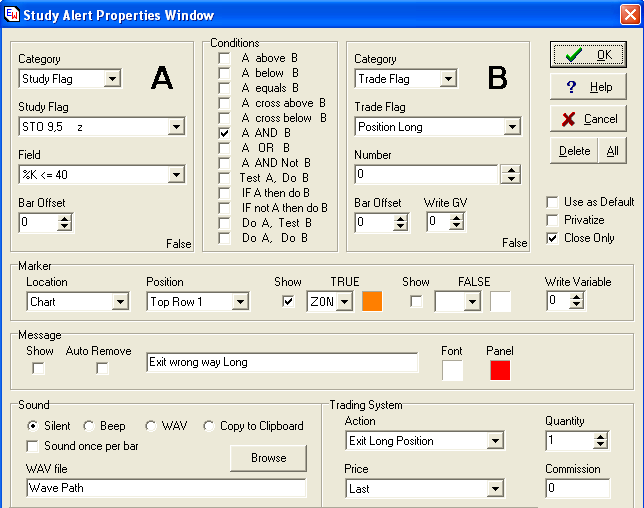
Exit Long positions if the Stochastic %K goes below
40. This is our wrong way protective stop. The
Study Alert to exit Short positions when %K is above 60 is similar
in design, but not shown here.
Design Summary:
This list of chart objects shows the final design.
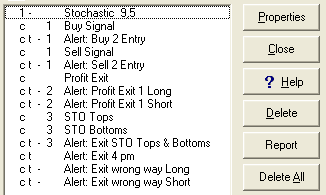
The chart has a Stochastic study, 5 DYOs with names
like Buy Signal, Profit Exit, and STO Tops. The Study
Alerts on the list begin with the word Alert: and have a name
descriptive of their purpose.
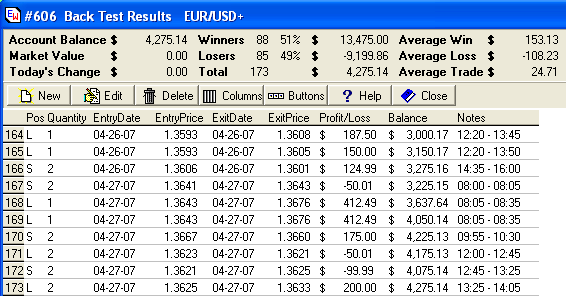
Trade Results:
Click menu Charts | Trade Detail to see a ledger of
all of the trades.
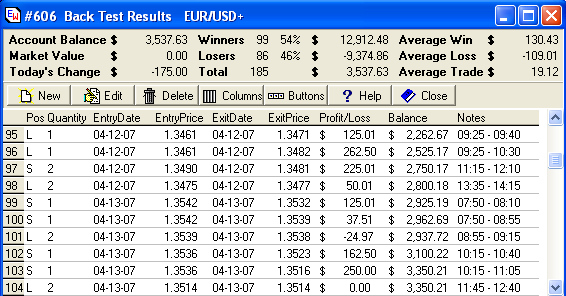
The top portion of the form shows summary
information. Our system is mildly profitable with a gain of
$3,537 in 1 month of trading. The Winners and Losers
count needs to be taken with a 'grain of salt' because of the way
the ledger logs our method of putting on 2 contracts, and then
possibly taking off one contract on a profit exit. Lines
95 and 96 show this effect. Line 95 shows a Long
Position of Size 1 with an entry price of 1.3461. The
profit objective was met on a later bar that closed at 1.3471.
The Notes show this trade was on from 09:25 until 09:40. The
2nd contract traded is shown on line 96. It was put on at the
same price of 1.3461 at 09:25, and removed at 10:30 at a different
price of 1.3482.
Line 97 is a Short with 2 contracts, and apparently
both contracts existed on the STO Bottom Exit condition. Line
100 is a Short that was reversed by a Long position being put on
because they share the same 08:55 time stamp in the Notes.
So the system really had fewer than 185 trades,
because many entries are just the ledger's method of keeping track
of partial lifting of a position. The actual Average Trade
would be higher than the $19.12 shown. At $19.12 the
system is just break even because commissions and slippage have not
been deducted from the results.
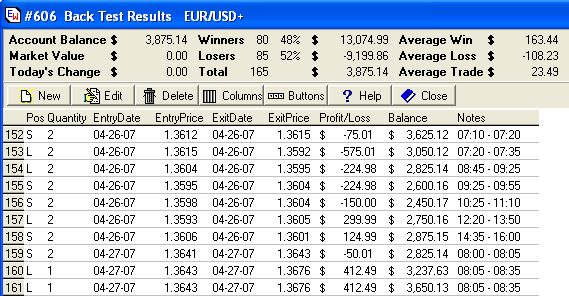
System Tweaking:
One of the unknowns was what scalp objective might be
the most profitable. The system was initially
designed with a 0.0010 pip profit object for the
EUR/USD. Lets modify the Profit Exit DYO, and the Line D
Number field. The following Trade Detail shows the result for
a profit exit of 0.0015 instead of 0.0010.
As hoped for (and expected) the trade results are
better. Fewer trades were made (which is good), and the profit
increased by $738. For the sake of an example, a profit
objective of 0.0020 will be tested and its results shown in the next
table.
I see the results are a few hundred dollars
lower. I do not know what the optimum profit exit for the
system would be, but that was not the objective in writing the
article. The article's purpose is to show how a trading system
of moderate complexity can be designed.
Another major exit condition was waiting for a 2nd top
or 2nd bottom in the Stochastic %K line. I am curious to
see if waiting until a 3rd top or 3rd bottom improves or worsens the
system. So changes will be made to the DYOs that test the top
and bottom counters. The profit objective will be returned to
0.0015 for this test, and the results are shown in the next
image.
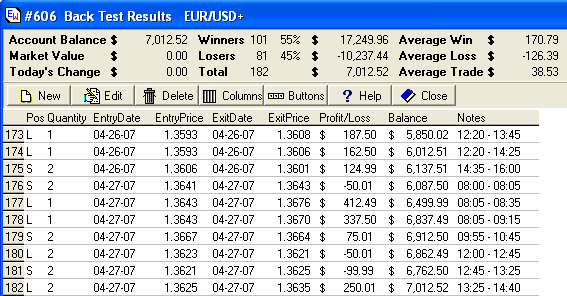
Now this shows a very nice jump in the Account
Balance. The system improved from $4275 to $7012, and the
average trade is high enough to start paying for slippage and
commission. This is exciting and worthy of further
research.
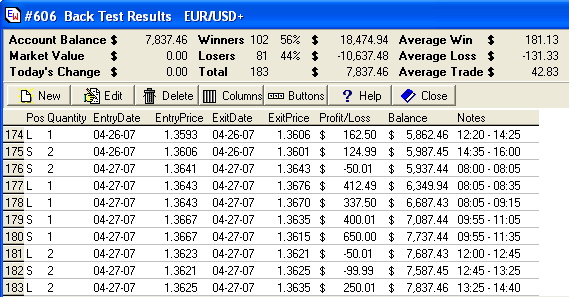
Another parameter to test is the Wrong Way Stochastic
trigger level of 40 when Long, and 60 when Short. I will
test the system with parameters of 30 and 70 used instead. The
results are shown in the next table, which are even higher, so this
change to the original design is yet another improvement.
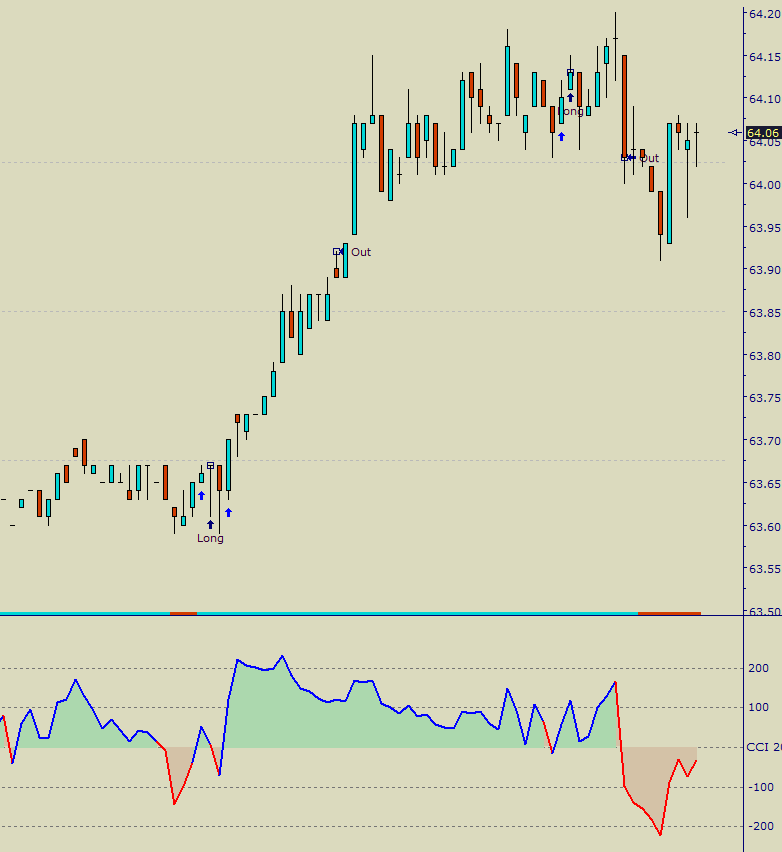
Here is an example chart showing the final
design with the colored stripes marking various trade actions.
The trades on the chart are those in the prior table, lines 176
through 183.
I know many of you will want to play with this Ensign
Stochastic System, so the studies, DYOs, and Alerts involved have
been saved as the EnsignStochastic template which can be downloaded
from the Ensign web site using the Internet Services form in Ensign
Windows. Enjoy and keep me informed if you discover
parameters or make changes that result in significant improvement in
the system's profit.
No warranty is made that future results will match the
results shown in this article. The trades shown in the article
are hypothetical, and no deduction has been made for commissions or
slippage.
Back Testing Tip:
Back Testing Signals![]()
by Christian Czirnich
Arrows on your chart. They look so good! And in
hindsight you see all these great trades that were marked on the
chart but somehow discount the losing trades.
But why do I have that warning voice in me asking me before I
take a trade: Is that really a valid signal? Yes, there
is that arrow, but .... You know not all of these signals
work. Do you really think you're smarter than all these other
geniuses out there designing trade systems for big firms for 6 to
7-figure salaries.
So another signal is not taken.
Enough!
Before I take one more trade I will have a very very long
look at my charts and confirm the validity of all these signals I
now place on my charts by cold hard facts. I need
numbers. I need statistics about the arrows on my
charts. And I can't do these by hand as I would never again
make a trade, if I need to rely on handwritten statistics
for say 10 symbols in 6 different timeframes for the last
3 months alone.
I need trade system analysis. Yes, I know the Tradestation guys
are laughing as that's one area that program is excelling in.
But,
- I don't have Tradestation
- I don't intend to switch and learn it only to come back to
Ensign after my statistic is finished
- I've used Ensign Software for 6 or more years and
- I'm convinced I can do everything TS can in Ensign as
well.
Fortunately Howard, the developer of the Ensign
Windows program is really a great guy and always willing to
help, if you have a question. He even makes adjustments and
additions to Ensign, when you have a reasonable suggestion,
which fits into his development plan.
First I wrote an e-Mail to Howard asking about trade system
analysis in Ensign and he answered me with 3 good resource links,
which got me started. Howard wrote back:
You would use ESPL logic to
implement your ideas and when you have a trade signal to either
enter or exit a trade you would use the ESPL commands for the
trade system. A ledger of your trades is made and some
statistics provided by that ledger. See these
examples.
http://www.ensignsoftware.com/tips/tradingtips42.htm
http://www.ensignsoftware.com/espl/espl119.htm
http://www.ensignsoftware.com/tips/tradingtips21.htm
Then I ran into some design problems and he added a new statement
to the ESPL programming language making the task I set for myself a
lot easier. Thank you Howard!
What did I do?
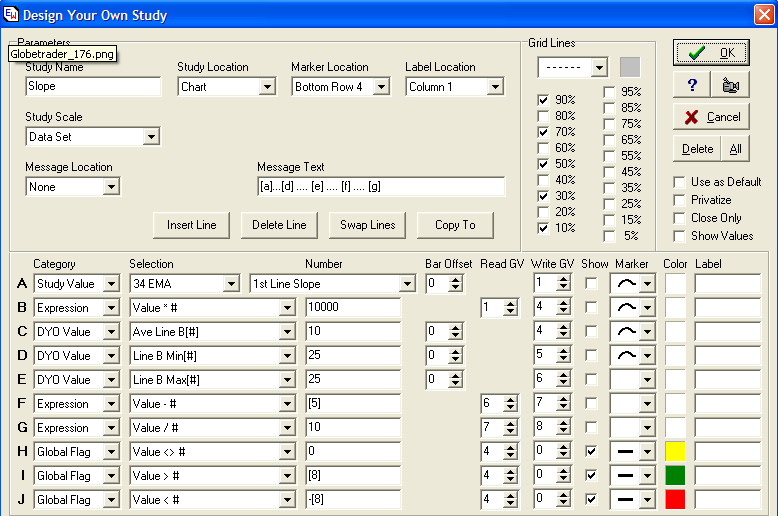
Designing Chart-Templates which paint an arrow once certain
conditions are met is simple in Ensign. The power of the
Design Your Own (DYO) study is really unmatched when it comes to
designing your own charts with bells and whistles. But the
trade analysis needs to be done in ESPL. So I adjusted
Howard's ESPL code, found in the resources he sent me, to
link with my chart template, added some trade management I normally
do in my own trading and here is the result:
You have the option to add to trades, to reverse trades on a
signal received or if the trade is stopped out. For
information purposes I also added the option to show individual
trade details. These statistics were generated trading a CL M7
2minute chart.
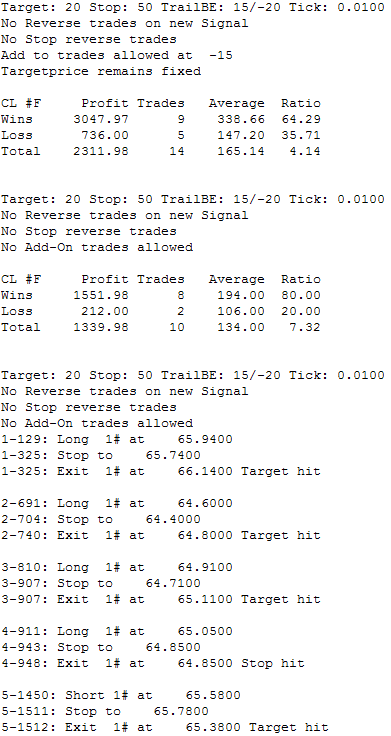
My Tradesystem is a simple trend following system, which goes
long or short on a retracement with the trend. Nothing
sophisticated and actually an example how trade management can turn
a profitable trade system into a losing one and vice versa.
I have designed the ESPL code in a way, that you can enter the
Tradetarget, the Stop and a trailing Stop in ticks, which makes this
code applicable to a wide array of symbols.
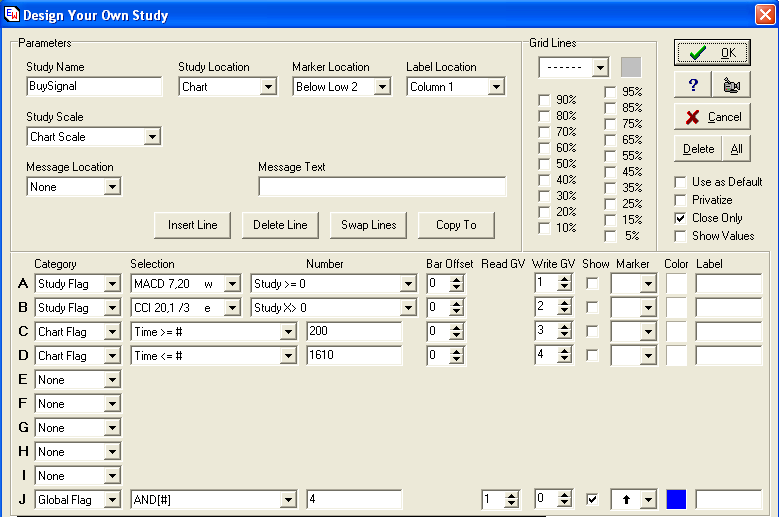
The Charttemplate itself needs to have 3 DYO Studies:
- One named "Buysignal" which goes True in Line J when a Buy is
triggered
- One named "Sellsignal" which goes True in Line J When a Sell
is triggered
- and one named Variables where you can transfer Numbers from
the chart to the ESPL program. Currently it needs to tell the ESPL
program only the minimumticksize of the symbol to be analyzed,
which is available in the [$Q] variable in Ensign.
Here is an example of the BuySignal DYO
Adjust the Slope DYO Line G to adjust the Flat
period of the indicator where no trades are taken.
The Tradesystem analysis is done in ESPL. First you need to
place the code in your ESPL directory [\Ensign\ESPL], then you need
to load it in the ESPL script editor and adjust the variables
according to your needs:
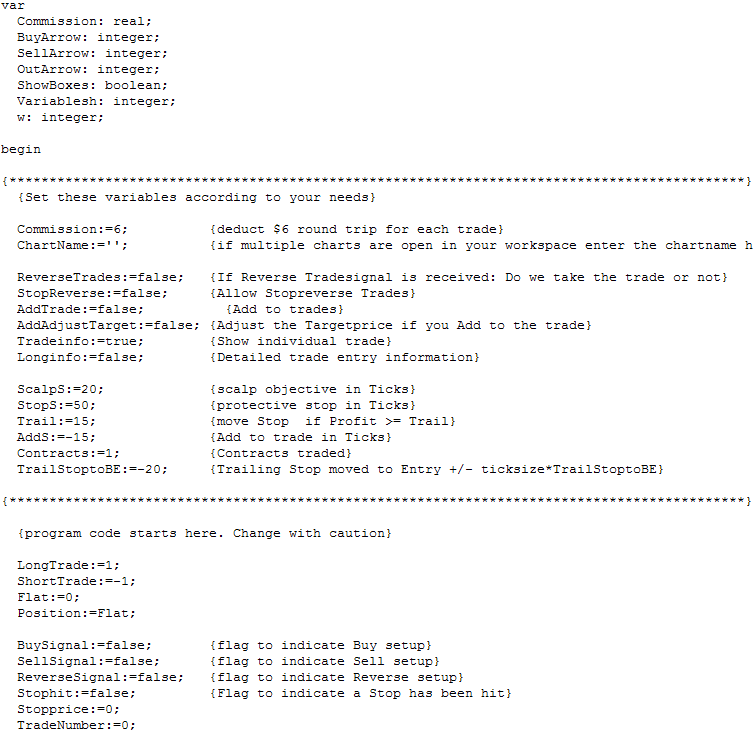
(You need to enter the chartname, if you have more than one chart
open when testing. I have made myself a Tradesystem Workspace with
one chart only, so I don't need to change the code, when switching
symbols)
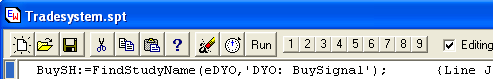
Click the [1] button on the ESPL editor form to clear the chart
and the Output window from any markers left from previous
tradesystem runs (if any). Click the [2] button on the editor
form to generate the Trade Statistics.
If you have Ensign and are interested in testing your own system,
here are the links to the Chart-Template
and the ESPL
code. Also see the http://www.globe-trader.de/TS-EMA-Trend.dat
template, as the chart picture shows the TrendCCI.dat Template while
the Slope DYO is part of the new template which trades bounces
of the 34ema and determines trend by looking at the slope of the
34ema. Both templates have a positive edge, so both might be
interesting for playing with. (Right click
the links and select Save Target.. to download directly in
the correct subfolders).
I wish you a profitable trade system analysis.
|