May 2007
Trading Tip:
Pyramiding a Position![]()
by
Howard Arrington
The April
2007 issue of the Trading Tips newsletter showed how a trading
system could be designed using the Design Your Own (DYOs) features
and Study Alerts in Ensign Windows to implement the logic and
execute the trades. A training class was given on the design
of the trading system and the class
transcript can be read to better understand the trading system
design.
This month's article will build upon last month's Ensign
Stochastic System to show how it can be improved by:
-
Controlling the entry price for the trades.
-
Managing the position size by adding rules for
pyramiding.
The purpose for writing this article is to teach you how to do
more complex things. I am not trying to pass out 'fish'..... I
am trying to pass out 'fishing poles' and show you how the fish can
be caught.
Controlling the Entry Price
In the Ensign Stochastic trading system, there are various rules
for entering a trade Long or Short, and then various rules for
exiting the trade with a profit, exiting based on the Stochastic
pattern, or exiting based on time. All entries and exits used
the Last price of the bar that created the signal.
Possibly the system could be improved by trying to get a better
entry price by one or more ticks. The issues to be researched
are whether too many trades would be missed, or whether the more
favorable entry would result in a bigger profit. So lets
modify the system to test these possibilities.
The signals to Buy and Sell will come from Stochastic %K being
below 30 and crossing above 50, or being above 70 and crossing below
50. But instead of executing the trade on the Last price of
the signal bar, lets pick a more favorable price and then have the
system check subsequent bars to see if the range of a bar covers the
better price, and then execute the trade. Some trades will
naturally be missed by holding out for a better price. Back
testing will reveal whether the system is better or worse for the
attempt.
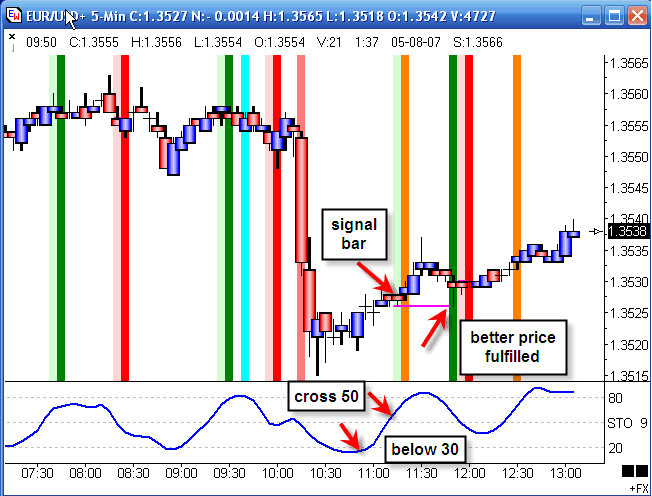
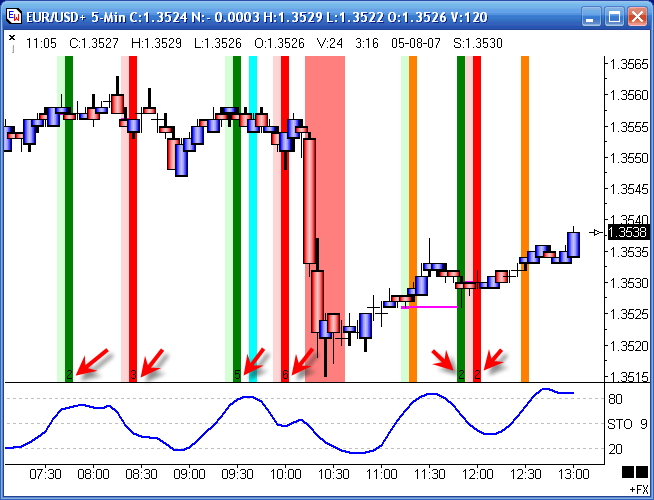
This chart shows an example of a Buy signal where the Stochastic
curve was below 30 and then crossed above 50. This signal is
marked by the pale green stripe on the chart, and the horizontal
pink line is the more favorable price I want to Buy at.
This price to enter Long is 1 tick below the Last of the signal
bar. This pink line will show on the chart sideways until it is
fulfilled, which in the example was about 7 bars later. The
actual trade to be Long was performed on the dark Green stripe at
the pink line price.
Parameters
Now let me show the DYOs that implement this kind of delayed
execution at a price under our control.
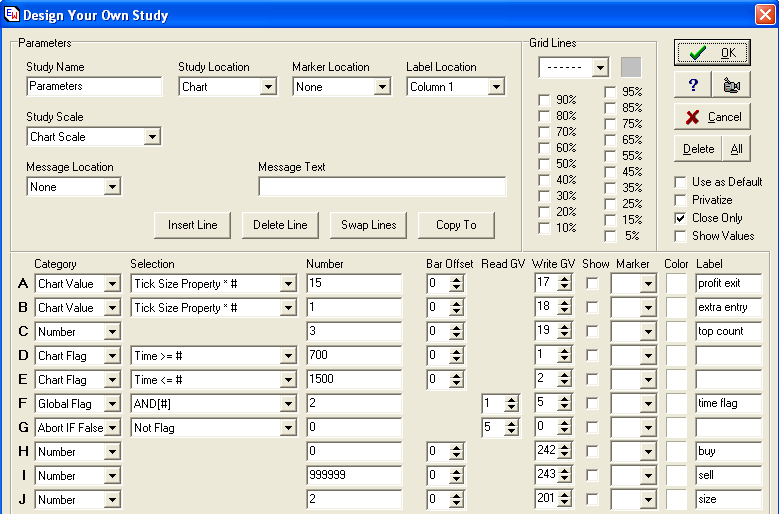
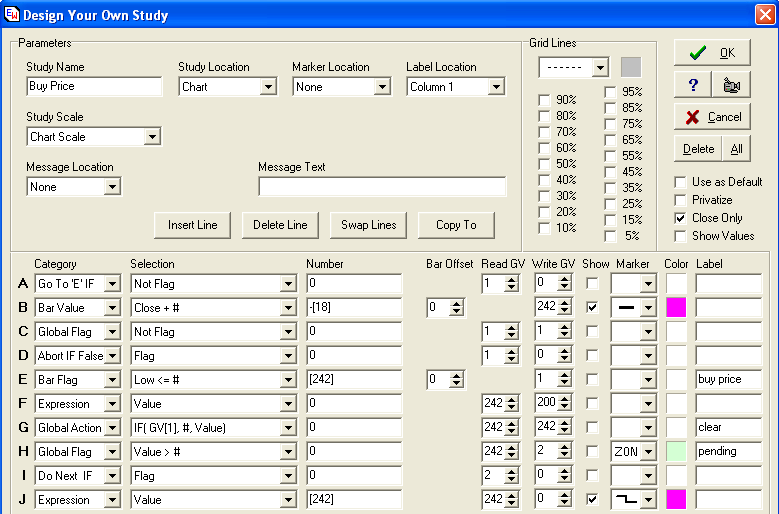
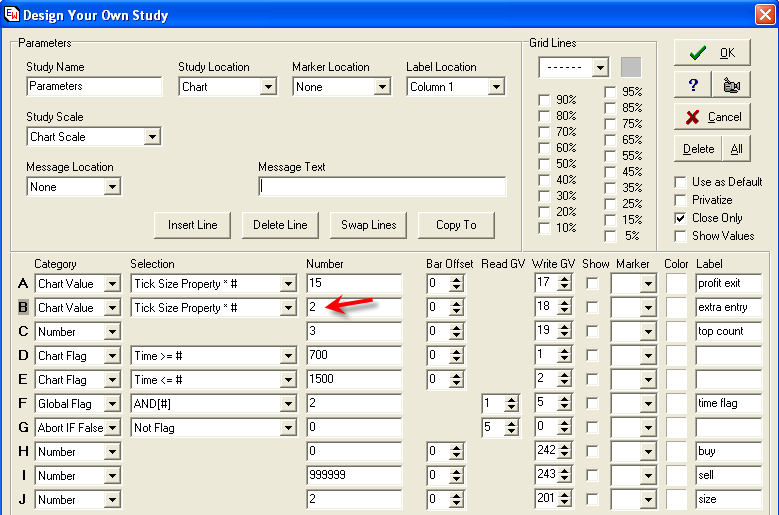
This is the first DYO in the modified trading system. It is
generalizing the design by using parameters which can be adjusted
for testing. In last month's design, one of the
parameters was a profit exit being 0.0015 points on the EUR/USD
forex chart. This was 15 ticks, and it was also 15 ticks in
the e-mini ES system design.
Line A is a way to generalize this parameter by first reading the
Tick Size property and multiplying it by the 15 and saving this
point objective in a Global Variable (GV). Later on when
a profit objective is tested, the contents of GV[17] can be used
instead of having a hard coded profit objective in points that is
unique for a symbol. This Line A profit objective is 15 ticks
regardless of the symbol. For example, 15 ticks for e-mini ES
is 15 * 0.25 = 3.75 points.
Line B will be a general parameter of how many ticks the system
is trying to hold out for as an improved price over the Last of the
signal bar. In the example the system is holding out for 1
additional tick on the entry. For a Long the entry price will
be the signal bar's Last minus 1 tick, and for a Short the entry
price will be the Last plus 1 tick. The entry price objective
is 1 tick more favorable than just trading the Last price from the
signal bar. Edit the Line B number field to be a 2 if you want
to try to hold out for an entry price that is 2 ticks more
favorable, etc.
Line C is the Top and Bottom wave count objective to control an
exit of the position. The parameter 3 was discussed in the training
class, but is put on this DYO and saved in GV [19] so we don't
have to find the wave count in a later DYO and edit it there to do
testing of a different parameter for the wave count
Lines D, E and F set the window of time when trading is permitted
and were discussed in the training class and in the April
newsletter.
Lines G, H, I and J control private Global Variables. The
price to Buy at will be in GV[242]. The price to Sell at will
be in GV[243]. The number of contracts to trade is initialized
to 2 and stored in GV[201]. These GVs will be erased or
initialized during the night session when the chart is outside of
the hours when signals can be taken. The hours when trading is
permitted are those on Lines D and E on this form.
Buy Signal
This is the DYO for the Buy Signal, which is very much like last
month's DYO and discussed in the training class.
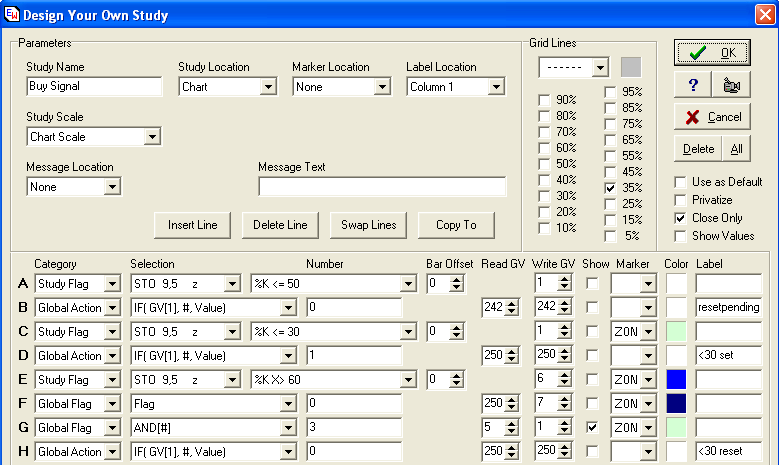
Line A tests when the Stochastic is Below 50, and when this
condition is True, Line B will reset the pending Buy price in
GV[242] back to zero. This test aborts a pending buy
when Stochastic is Below 50.
This DYO keeps track of the condition for the Stochastic being
below 30. Line C will be a Boolean True when the Stochastic %K
is below 30. This condition is then remembered in GV[250] by
Line D putting the number 1 (a Boolean True flag) in GV[250].
The signal bar is when the Stochastic then crosses above 60 (in
my example.) For the EUR/USD chart a crossing above 60
produces better results than a crossing above 50. The results
are similar. The idea is the same. Line E will be a
Boolean True when the Stochastic %K crosses above 60. This
condition is stored in GV[6]. Line F moves the flag in
GV[250] to GV[7] for testing.
Line G is the AND operation of GV[5] AND GV[6] AND
GV[7]. GV[5] has the flag for the Time test from the previous
DYO. When all three conditions are a Boolean True, we
have a Buy Signal. This signal bar is marked by a vertical
pale green stripe on Line G. And Line H resets the Below
30 condition flag remembered in GV[250] to a Boolean False.
Buy Price
This DYO implements keeping track of the price to Buy at, and
when that price is fulfilled, executing a Long trade.
The Buy Signal from the prior DYO was stored in GV[1] so it can be
tested in this DYO on Line A. When the bar is not a
signal bar, execution jumps down to Line E and checks to see if this
bar's Low fulfills a pending Buy Price.
Lets assume we have a signal bar (pale green stripe) and thus
execution continues on Line B. Line B will read this signal
bar's Last and subtract the extra hold out point objective stored in
GV[18], which was set by Line B in the Parameter DYO.
This new better price to buy at is then saved in GB[242] and marked
on the chart with a pink line.
At first glance it looks like Line C and D could be combined
because their end result is to abort this DYO. Line C
first clears the signal flag in GV[1] by doing a Not operation on
the flag. This is done because GV[1] will be used by the next
DYO. Line C is clearing this flag so we do not buy on the
signal bar. The signal bar just sets up a pending buy and that
still requires a subsequent bar's Low to cover for a Buy
fulfillment. Line D then aborts execution in this DYO because
this is the signal bar.
Line E tests a non-signal bar to see if its Low is at or below
the Buy Price in [242]. This Buy price is moved by Line F to
GV[200] for use in the next Study Alert as a special GV that can
hold the price for a Study Alert to buy at.
Line G tests the Buy flag in GV[1] which was the Low being at or
below the entry price. This is the signal to execute the Buy
at our price in [242] and in [200].
Line H tests whether we have a Buy price in place. It will
be zero if we do not have a pending Buy, as is the case from the
initialization done before the market opens. You can check the Show
box on Line H to add more light green stripes if you want a
continued reminder a Buy is pending. I found that it was
sufficient just to have the Buy price continue to be shown as a
horizontal pink line and that is what Lines I and J
accomplish. If the Buy Price is non-zero, then the Buy order
is pending and the Buy price shows as a pink line on the chart, as
in the example chart shown earlier.
Buy Execution
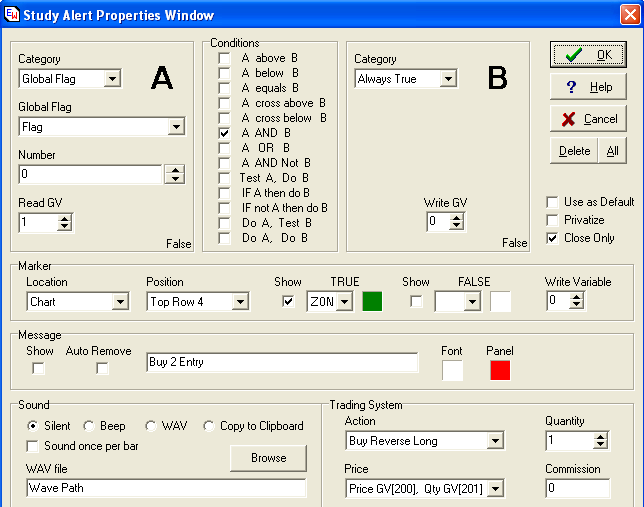
This is the Study Alert that performs the Buy action. It
looks at the flag in GV[1] which was the test for Low <= Buy
Price. Note the Price selection box in the Trading System.
This selection says to use as the trade Price the value in Global
Variable [200]. This is why the prior DYO moved the Trade price from
the private GV[242] into GV[200]. The Trade Size or
Quantity will be the value in GV[201], which overrides the setting
in the Quantity spinner box.
Look at the example again now that we have run through the logic
for the Buys. Each Buy is the dark green stripe and it
is preceded by a pale green stripe which is the pending Buy
signal. On the first 2 Buys the trade bar immediately followed
the signal bar. With the pale green stripe, the intent is to
buy when the market covers the Buy price which is one tick lower
than the signal bar's close. And in the first two Buys, the
following bar gave the better fill price. In the case of the
3rd dark green stripe, we had to wait 7 bars to get the pending Buy
order filled.
Do you see where I am headed with this example? Do you like
the possibilities that are being demonstrated? In my opinion,
this system has a greater resemblance to reality. You see a
signal, place a Limited Buy order, and wait for the order to be
fulfilled.
Sell Signals
Now, I do the same thing for the Sell signal being pending with
the pale red stripe and the actual Sell being accomplished with the
dark red stripe. The Sell price is 1 tick above the signal
bar's Last price. Fulfillment does not happen on the signal
bar, but rather may happen on a subsequent bar. The 3 dark red
stripes in the example all fulfilled on the bar following the signal
bar for going Short.
Between 10:00 and 10:30 we have a red stripe that is medium dark,
and this is a marker for one of the exit signals at a profit
objective. The dark red stripe at 10:00 sold 2 short, and the
medium red stripe 3 bars later lifted one contract at a profit
objective. The profit objective exit still uses the Last of
the bar it exits on. This exit on the profit objective is
based on the bar's close, which can be greater than the 15 points
set as the minimum for a profit objective. The exit on the
medium red stripe was the close of that big down bar. The exit
on a profit objective is the same as discussed in the April
newsletter.
The example also shows an orange stripe at 11:20 which is the
exit of the 2nd contract from the Short at 10:00. This exit is
based on the Stochastic climbing above 70 while the position is
short.
The bar ahead of the orange stripe is a signal for a pending
Buy. In the April newsletter design, that signal would have
exited the Short and put on 2 Long contracts. With the change
to hold out for a better entry price, the exit was triggered by one
of the conditions to abort a trade which seems to be going the wrong
way. So the 2nd contract of the Short was exited at the
orange stripe. The abort for a wrong way Stochastic still use
the signal bar's Last price. I did not want to monkey around
with the safety net. If you get a signal to abort, just do
it. Trying to hold out for a better price when exiting might
be hazardous. I am only holding out for a better price on
Entries. If I miss the entry price all that happens is I am
left on the sidelines waiting for the next train to leave the
station. I can live with missing a trade because I still have
my capital in hand to trade with. For an exit signal based on
Stochastic being the wrong way, and for a Time of day exit, etc,
just exit on the signal bar and use the Last as the exit price.
Trade Detail
Click menu Charts | Trade Detail. This shows a summary of
the trades made by the Ensign Stochastic System. Let me show
you a summary from the April newsletter's system so I can compare it
with the modification that attempts to get a better
price.
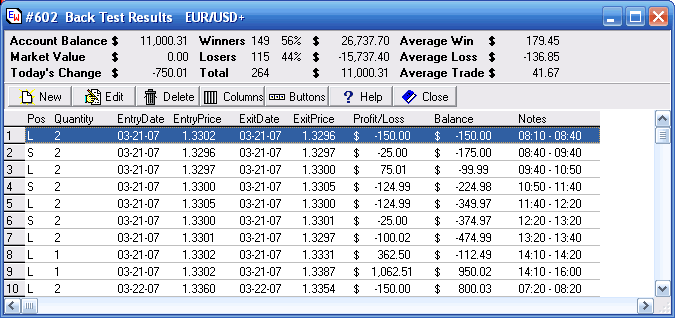
The form above shows the results of using the system designed in
the April Trading Tips newsletter, which executes all trades at the
signal bar's Last price. The key numbers of interest are the
Account Balance of $11,000 and Total Trades of 264.
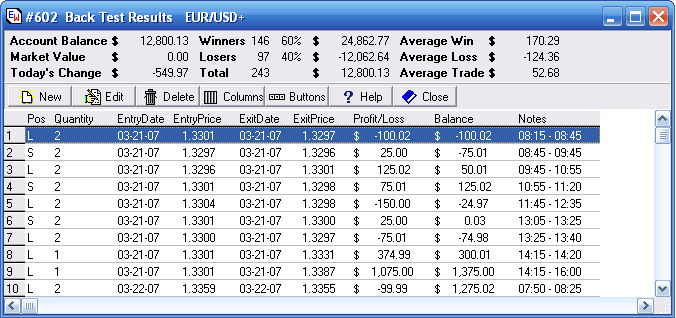
This 2nd summary is for the new system that tries for a 1 tick
better fill price for Entry on trades. Note the improvement in
the profit is $1800. Profit is $12,800 versus
$11,000. The Total trades is 243 instead of 264, so it
must have missed taking some trades. That was to be
expected. Looks like it missed 20 out of 264 trade, or about
8% of the time. However, since the profit improved, I consider
this a good thing. It missed mostly losing trades by dropping
Losers from 115 to 97.
The Average Trade in the prior form was $41, and now it is
$52. That is about the size of 1 tick of added profit on each
trade. So the average profit increased, as would be expected
since the system holds out for a better fill price.
Since the system has a Parameter DYO where the number of ticks to
hold out for can easily be change, my next test waits for a fill
price that is 2 ticks better than the signal bar's Last price.
The Line B Number field has been changed to be a 2, instead of a
1. Now the system will try for a two tick better price (lower
price) on a Buy and (higher Price) on a Sell.

The number of trades dropped to 217 from 243, so many more trades
were missed. These missed trades affected the profit
more than was made up by the added tick in the profit of profitable
trades. It is wonderful for the system to find these answers.
Possibly more trades were exited at our abort conditions as was
illustrated in the chart earlier at the orange line. That one
example showed the exit of the short trade was at a worse price, and
offset the benefit of trying to get a Buy at a better price. I
will return the parameter back to a 1.
This research tool is giving you the fishing pole so you can do
more research in this area of adjusting the entry
price.
Pyramiding a Position
Now lets move on to the 2nd improvement in the trading system
design by managing the size of a position through pyramiding.
I will leverage on the system design shown so far, and keep
the improvement of holding out for a 1 tick better price to Enter
positions.
Twenty five years ago when I was first searching for the Holy
Grail, I observed that a good winning trade often was preceded by a
losing trade. And this is a big CLUE that I have not seen in
publications anywhere, so let me emphasize it by discussing it.
We often look for good markers, clues or signals for when to make
a trade. Yet, we emotionally do exactly the opposite of what we
should be doing. When we experience a losing trade, the
natural reaction is to be hurt, recoil, and say I am not going to do
that again. Then when we have a winning trade, we get
too confident and trade a bigger position and then get really hurt,
and start all over again.
As a kid I would play a game called 'double or nothing'. If
I was trying to take my brother's money, and I had lost to him, I
would say double or nothing, and we would flip the coin again.
Eventually I won and would erase my debt. Now think about that
simple example of double or nothing. If you have been a
winner, you will eventually lose and return to zero. If you
have been a loser, eventually you will win and return to zero.
'Double or nothing' is a form of Pyramiding, but as a child I did
not know that big word existed.
Pyramiding Theory
Let's apply the principle, however, to the trading system
design. I can show you it works in a moment. First I
need to set out a ground rule and discuss the theory of why it
works. Lets go back to a classic wave model where a
trend unfolds in waves that we can generalize as Trend - Reaction -
Trend - Reaction - Trend. This is the Elliott 5-wave pattern,
which I will shorten to the notation T-R-T-R-T.
The Ensign Stochastic system, and most systems, are able to
extract a profitable trade during a trend or the T wave. But, what
follows a T wave most of the time??? It is a reaction
wave or a correction wave which I show as an R wave. Most of
the losing trades happen in the R wave. And then being bruised
we emotionally are on the sidelines just when the next T wave is
starting. Instead, we should recognize that T follows an R,
and statistically, the best time to pocket a winning trade is
following an R wave.
DO YOU SEE THAT? If I can share any key concept in this
article, it is this concept about T_R_T_R_T patterns.
The probability of a winning trade is greater following an R wave,
or following a losing trade. So, lets put that characteristic
into our system
If we have a winning trade, assume it was in a T wave, and we
should reduce our exposure for the anticipated R wave due next. Now
it might be T-T pattern at a nice V top or V bottom turn. The
market might be starting a whole new trend and that would be the
case after a 5th wave starting a new 1st wave, for a T-T pair.
So we do not want to be out of the market. We just want to
manage the risk better by having a reduced exposure since an R wave
follows a T wave more often than T follows T.
The first rule will be: If the last trade was a winner then
reset our trade size to the default of 2 contracts. This
is the size used in the system shown above. A new trade was
initiated with 2 contracts, and then had options to lift one
contract at a profit objective and let the 2nd contract run its
course to be exited by Time or by a Stochastic pattern.
In the pyramid model, I will begin with 2 contracts, and return
to trading 2 contracts after a winning trade. But after a
losing trade, my hypothesis is that I will have a higher likelihood
of having a winning trade because T follows R more often than R
follows R. After a losing Trade, assume it was because
of an R wave, and a trend wave will follow. Therefore, we
should trade a bigger position. The 2nd rule will be:
After a losing trade, increase the position size by 1 and trade 3
contracts. If we lose again, increase position size by 1 again
and trade 4 contracts.
Some of the abort signals such as the wrong way Stochastic are
good indicators too, like a strength of signal or quality of signal
indicator. After these abort signals, lets increase the size
by 2 instead of by 1.
Buy Size
Let me show the DYO that implements the pyramiding rules.
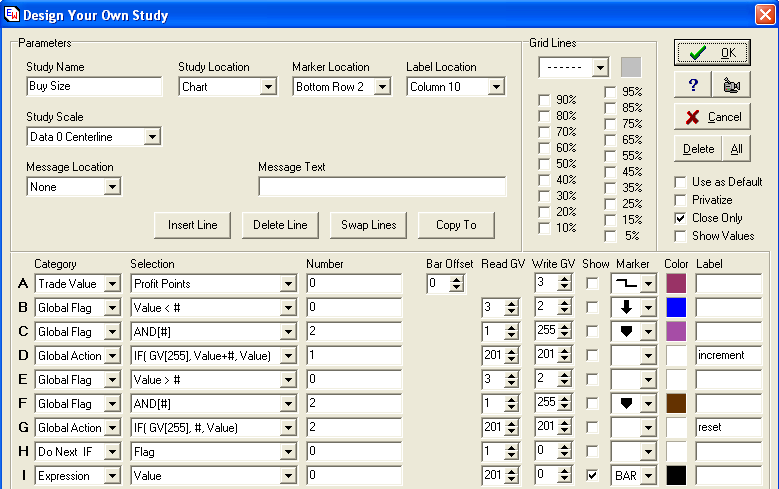
Line A will see what the current trade's profit is in
points. All I really care about is whether it is a winner or a
loser, so the points are compared to zero by Line B. This
profit or loss flag is saved in GV[2] by Line B.
Remember, GV[1] has our flag to execute a trade, such as the
pending Buy signal was Low <= Buy Price. When the
current trade is showing a loss, and we are ready to do a Buy
Signal, Line D will increment the trade size amount stored in a
private GV [201].
This trade size was initialized to be a 2 before the trading day
began, and it is also reset to a value 2 after any winning
trade.
Lines E, F, and G perform the reset when the current trade is
profitable, and there is a signal to Buy in GV[1]. Line G,
when the flag is True will read the number 2 from the number field,
and write it to GV[201], otherwise leave GV[201] alone.
So in summary, Lines A, B and C will increment the size to trade
when the current trade is a loser, and Lines E, F and G will reset
it back to a value of 2 when it is a winner.
Lines H and I do a little visual of showing this trade size or
quantity on the chart on the stripe for the trade execution.
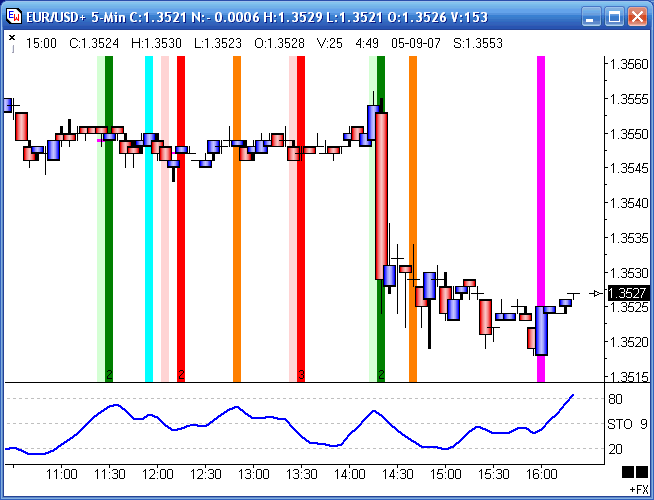
This chart is an example of the Pyramid system in
operation. The first trade was a Buy and the buy size was 2 at
7:40. Then at 8:20 there is a Sell signal and execution.
The Long trade was unprofitable so the Short used a position size of
3 instead of 2.
There is a Buy signal at 9:30, and underneath that pale green
stripe is an orange stripe for the bail out of a short with
Stochastic above 70. The bail out found the position was a
loser, and incremented the size by 2, so a Long trade of 5 was put
on.
The 10:00 signal was to go short, and the last trade was again a
loser, so it traded 6 short. Wow, what discomfort in having 3
losing trades in a row, though they were all small losses.
However, there is joy in being loaded up for the only good trend in
the day.
At each of the medium red stripes, a profit objective is met, so
that signal removes one trade at the bar's close. The system removed
one trade at 5 different bars at 5 different bar closes. These
happen to be some pretty nice exits into the bottom of the
plunge.
After 10:35 the system still has 1 Short on, and this was exited
at the orange stripe, (the Stochastic above 70 abort rule), but
still at a very nice profit. Then the green Long trade is
following a profit and the trade size is set back to 2. The
red Short at 12:00 is after the green profit (small one) so trade
size stayed at 2., and then was closed out at the abort rule for a
small loss.
Now that you understand the theory behind the idea, and see its
implementation, I need to show you the Study Alert for the Buy.
Note the Signal to buy is still the GV[1] as discussed in the
first part of this article. The Price selection shows the
Price is to be found in GV[200] and the Quantity is to be found in
GV[201]. This selection will be an override of the Quantity
spinner box. I use this selection so I can have the DYO manage
the trade quantity, and disregard the Quantity spinner setting on
the Study Alert form. Now it makes more sense why in the last
DYO shown I did the increment or reset for the trade size in
GV[201].
Pyramid Trade Details
Now lets look at the trade detail summary for the Pyramiding
system.

The Profit has jumped from $12800 in the system from the first
part of the article to $23,062. This is an excellent
improvement. The system did not really increase the trades
from 243 to 265. All it did was change the sizes in the
trades. The count increase is due to more trades being lifted
one at a time, like the example just discussed, and each lifted
trade occupies a separate line in the ledger.
For example, ledger Line 7 was a loss of $75. Lines
8, 9, and 10 are the 3 contracts traded in the next trade started at
14:15 but lifted at different times. One was lifted at 14:20
on a profit exit. One was lifted one bar later at 14:25 on a
profit exit. The 3rd contract was removed at 16:00 on an end
of day time exit rule. See the Entry and Exit times for the
trade in the Notes field.
The Pyramiding model that can trade a bigger position, such as 3
contracts, may use more lines in the trade details ledger to show
how these contracts were resolved.
Today's Change
The value on the Today's Change shows the change in the Account
balance for the trades made just today. The account was at
$23,686 yesterday. The system was doing fine today (May 9th,
2007), until it got caught on a whip lash into the plunge. Let me
show the trades for Today's Change of -$625.
The system was short 3 contracts at 13:30, and the Stochastic
poked its head up over 50 on that nasty little poke bar at 14:20.
That primed the system for a pending Buy, which was filled by the
plunge bar at 14:25.....ouch..... bad stuff happens...... and no
trading system is immune to it.
The prior example showed being loaded up and on the right side of
the plunge, and how the system lifted trades on profit exits. This
example shows being on the wrong side of the plunge. But it
came so close to being on the right side.... if only that Stochastic
value had stayed below 50 it would have been short. Or if the
Stochastic had not gone below 30 ahead of that it would not have had
the Buy setup signal.
However, if I try to tweak the system in hindsight to make a
better trade for today's plunge, I do so at the risk of worsening
the system for other days. The beauty of back testing is
you can adjust parameters and see the effect on everything, and not
just the effect on the one case you are staring at. I have to
show the system as designed, and today was a punch in the eye.
Still the system shows a handsome profit for 6 weeks of back
testing. I am not worried..... just bruised a bit from
today. I have confidence the system will recover today's
losses.
Wrong Way Exit
You may want to add rules to manage a protective stop for a
runaway market. The abort rule for being the wrong way was
watching Stochastic being above 70 when Short or being below 30 when
Long. In the example, this rule aborted the Long position on
the orange stripe 4 bars after the plunge.
You would add a DYO that implements more rules for an exit on a
loss, similar to the logic for an exit on a profit objective.
However, it would not have helped this particular example much
because the bar to Buy just happened to be the plunge bar and the
system might not have tested your protective stop until the next bar
since it is a Close Only option on all the DYOs.
Back Testing
Back testing is across all data in the chart file, and my chart
file example had data from March 21st. That was sufficient for
me to get some results. If the file were twice that size, I
could expect to have twice as many entries in the Trade Detail
ledger. Also a bigger file takes longer to calculate, and
these DYOs and Alerts can be CPU intensive. Therefore,
when designing I make frequent changes to the property forms and do
not want to wait a long time for each change to
recalculate. I clipped the file by deleting bars ahead
of March 21st. I try to be practical about the file size as I
research ideas and implement them.
The reason for having the Close Only option checked is that in
hindsight I cannot execute signals intra-bar. In hindsight I can
only see where Stochastic ended on the bar, for example. So to
match the same model for real-time you should have Close Only
checked so the signals like Stochastic are checked only on the close
of the bar. Stochastic might have gone above 70 intra-bar and
then been below 70 at the end of the bar. You would not want that
momentary move above 70 to affect your trade results.
Also, I would not use (H+L)/2 as an entry or exit price
because the results will typically be biased and you cannot get the
fill price. For example, in a down move, the signal might be
to go short when Stochastic is lower. Stochastic will be lower when
a close is on the bottom of the bar, and the average of the range
would statistically to be a more favorable price to sell Short at
than the bar's Last price. So use the price nearest the
calculation, which is Last for a Close Only evaluation, or use the
ideas shown in this article where you pick your price and then watch
to see if you are fulfilled on a subsequent bar.
The Pyramid trading system can be downloaded as a template from
the Ensign web site using the Internet Services form. The
template has been saved as EnsignPyramid.
No warranty is made that future results will match the results
shown in this article. The trades shown in the article are
hypothetical, and no deduction has been made for commissions or
slippage. |