June 2007
Study Tip:
MACD Fundamental Behavior![]()
by Howard Arrington
To understand a study more thoroughly, it needs to be observed on
a theoretical Elliott wave formation. To often a study is
slapped on a chart, adjustable parameters are tweaked, and with the
benefit of hindsight some trade signals are derived. The
advanced student might go the extra mile and delve into the
mathematics of the study's formula. But the fundamental
behavior of the study is not understood well. This article
will help you understand the Moving Average Convergence Divergence
(MACD) Oscillator better through an original approach.
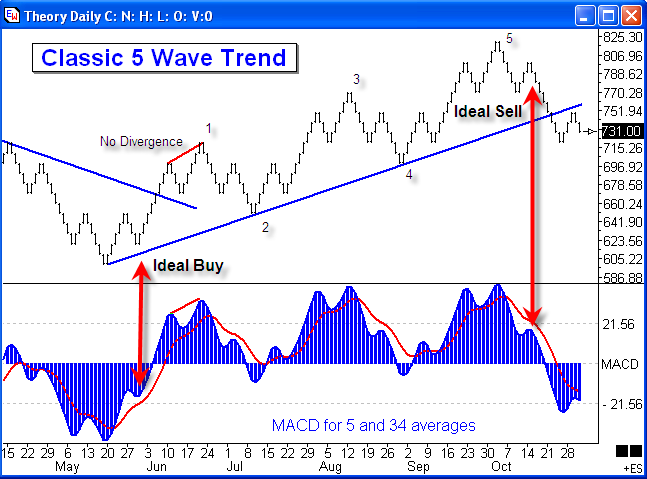
The basic concepts of the Elliott Wave Theory are that action is
followed by reaction, and there are 5 waves in the main trend,
followed by 3 waves in the correction. Since this
pattern is seen over and over in the markets, a theoretical
chart based on these principles will be used so MACD can be analyzed
without market 'noise' obscuring its fundamental behavior.
The MACD is the spread between a short period average and a long
period average. Typical parameters for the two averages are 5
and 34, which will be used in the examples for this article.
Various characteristics can be found in the 5/34 MACD
study applied to this theoretical chart.
1) Divergence is not present as the price action
puts in any of the swing tops or swing bottoms. Other
studies, however, such as Stochastic
and R.S.I.
often show divergence.
2) The patterns formed by waves 1, 3 and 5 are
very similar. So traders really need to count waves and wait
for the completion of the 5th wave to have the ideal entry signal.
3) The pattern at the Ideal Sell is a lower
right side shoulder on both the price action and on the MACD
study. The pattern at the Ideal Buy is a raised right
side shoulder on the chart and on the study.
4) If you want an earlier signal you might plot
a Moving Average of the MACD such as is illustrated by the Red study
line. The signal would be the MACD crossing its average.
In the example, a 9 period average is plotted as the Red
line. Again, wait for the crossing after the 5th wave is
in place.
5) The a-b-c correction in the retracement waves
2 and 4 will cause the MACD to cross its average and cross below the
zero line. Both of these would be false
signals. Wait for the completion of the 5th wave.
Average Formula:
Now that the fundamental behavior of MACD is
understood as the Elliott waves develop in a market, the theoretical
chart will be used to observe the effect of different average
formulas. The first decision is whether to use Simple,
Exponential, Weighted or Howard's averages in the MACD
calculations. All examples shown in the next graph use
the same 5 and 34 parameters for the two averages.
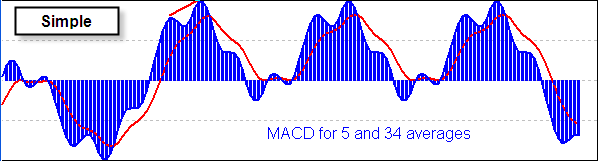
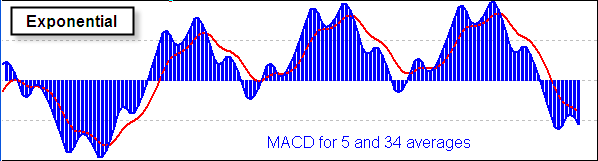
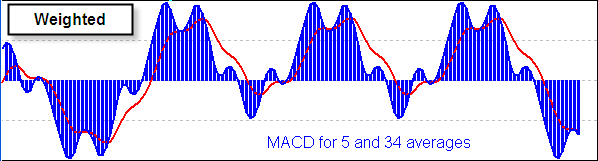
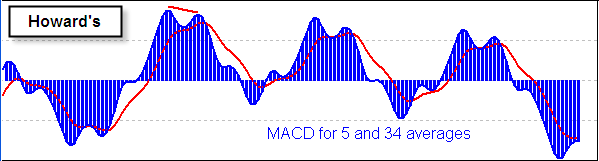
The only significant difference observed here is that
Divergence is present when the Howard's moving average formula is
used. Note in the plot for the Howard's formula that the hills
for the 3rd wave and the 5th wave are decreasing in their
amplitude. Click here to learn more about Howard's
formula.
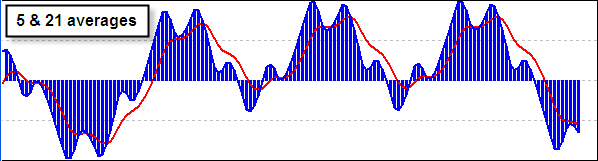
Average Parameters:
Now the parameter for the 1st average will be varied
to see the effect it makes in the MACD plot.
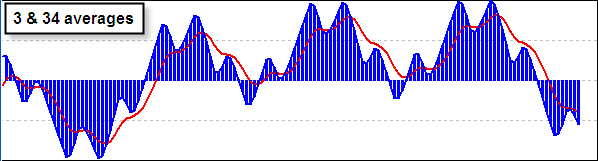

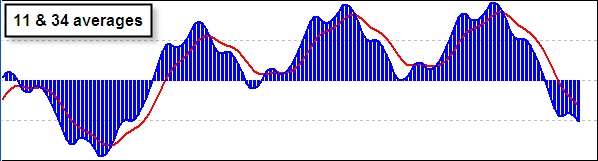
The observable difference is that a higher parameter
results in a shallower valley. The pattern remains basically
the same.
Now the 2nd average's parameter will be varied.
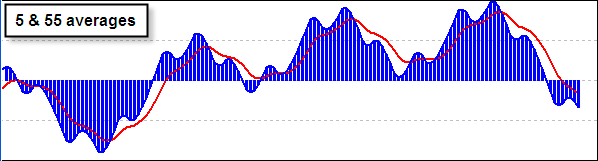
There is a bit of Divergence in the 3rd and 5th wave
patterns when a smaller parameter is used for the 2nd
average. The patterns and signal interpretations are
basically the same, regardless of the parameter used for the 2nd
average.
The theoretical chart has been very helpful in gaining
a better understanding the fundamental behavior of the MACD
study. Click the links below to read other articles
where the theoretical wave has been used to discover the fundamental
behavior of other studies.
|