September 2000Trading Tip:
A-B-C Wave Forecast
by Howard Arrington
Ensign Windows has a wide variety of draw tools and technical
studies. This issue highlights the ABC wave forecast
tool. To draw the Elliott Wave ABC lines on a chart,
click the Draw Tools button on the main button bar, and
then click on the Formations button. The cursor
will change to a pencil while in the draw mode. Use ABCs to
mark price and time movements from important highs, lows, and
corrections. They can also be used to indicate the possible
turning point of the current trend or correction.
Three points are necessary to draw ABCs on a chart. To draw
the ABC tool on a chart select the 1st point from an intermediate
high or low by moving the cursor to the point, then hold down the
left mouse button and drag to the 2nd point (end of wave A).
The 2nd point should be the high or low of the subsequent
correction. Release the mouse and then move to the 3rd point
(end of wave B). The 3rd point is generally the
point where the correction ended. Click the left mouse
button to mark the 3rd point. You have manually traced
the A and B waves, and the tool forecasts the C wave. The
principle is that wave C will have the same magnitude, duration, and
slope as wave A.
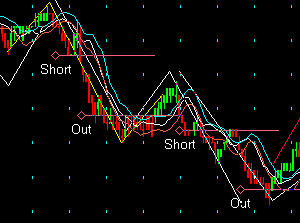
The following illustration was cut from the middle of a
customer's chart which was sent to Ensign Software as an e-mail
attachment.

It is always refreshing to see customers putting to good use the
tools and features built into Ensign Windows. Let's talk about
some of the tools and studies I see the customer is using in his
analysis. The A and B waves of the yellow ABC tool helped
correctly forecast wave C. The A and B waves of the following
white ABC tool have helped forecast the slope and extent of its wave
C, which this customer traded short and nailed a great exit
price. I believe the customer actually sold the market short
at the levels indicated, and covered his short trades at the levels
marked by 'Out'. So, he uses the ABC wave forecast tool in his
analysis and marked his trades using the Arrow tool.
The chart shows a study, possibly some kind of averages of the
bar highs, bar lows, and bar closes. I do not know which study
is on this chart, its parameters, or its interpretation. The
customer also uses three more studies drawn in two study sub-panels
below the chart (not shown). The vertical lines of blue dots
are from a cycle tool. The bars are drawn using candlesticks,
and painted with the Trends or Small Trends color bar study.
Well, you might ask, 'Why don't I know more details about what this
customer is doing?' I didn't ask, and he didn't volunteer any
details. Besides, all I am trying to show with this
illustration is the use of the ABC tool in real-time trading, which
has been done skillfully. I consider an actual undoctored
example worth a lot more than my putting an ABC tool on a chart with
the benefit of hindsight. This illustration of the ABC tool on
an actual chart is an excellent example for this article. I
hope you have picked up an idea or two to use in your trading.
Article:
Tick On Balance
Volume
by Howard Arrington & Kimball
Hansen
Customers recently requested the ability to accumulate up and
down tick volumes. A new statement was added to ESPL to
support tapping into the data feed so that this could be
accomplished for a few symbols using ESPL. The new statement
is an AlertEvent that fires a call to ESPL each time a trade tick is
received for a symbol on the alert watch list. The following
ESPL script illustrates the AlertEvent statement and how volumes can
be accumulated and plotted.
// BidAsk.spt -- On Balance
Volume (OBV) for Bid and Ask trades
//
// Click Menu 8 to
start the program.
// Click Menu 9 to stop the
program.
//
// This program updates a User Defined Symbol for
a stock's BidAsk tick volume.
// Tick volume for Ask Price trades
is added to the running total (buy volume).
// Tick volume for
Bid Price trades is subtracted from the total (sell volume).
// A
custom symbol named symbol+'OBV' in the Cash market group has
the results.
//
// AlertEvent(eTrade) calls ESPL for each
alert symbol trade.
procedure
Start;
begin
Output(eClear); writeln('Process
Started');
Alert('IBM',FindMarket('IBM'),0,0);
{Create Alert for
IBM}
Alert('@ES0Z',FindMarket('@ES0Z'),0,0);
{Create Alert for @ES0Z}
{repeat the above
statement to add
others}
AlertEvent(eTrade,99);
{Setup AlertEvent}
end;
procedure Stop;
begin
writeln('Process
Stopped'); AlertEvent(eClear); {Stop the
AlertEvents}
Alert('IBM',
FindMarket('IBM'),0,eNone); {Remove
the IBM Alert entry}
Alert('@ES0Z',
FindMarket('@ES0Z'),0,eNone); {Remove the @ES0Z Alert
entry}
{repeat the above statement to remove
others}
end;
procedure
ProcessTrade;
var
Market,IncVol,Vol:
integer;
MidPrice: real;
begin
if
Find(eCash,IT+'OBV') then
Vol :=
GetData(eLast,True) {Retrieve Cumulative
Volume}
else
Vol :=
0;
Market:=FindMarket(IT);
MidPrice:=
(GetData(eAsk,True)+GetData(eBid,True))/2;
if
GetData(eLast,True) >= MidPrice
then {Add the Ask Tick
Volume}
if Market=eFuture then
IncVol:=GetData(eAskSize)
else
IncVol:=GetData(eTickVolume)
else {Subtract
the Bid Tick Volume}
if Market=eFuture then
IncVol:=-GetData(eBidSize)
else
IncVol:=-GetData(eTickVolume);
Update(IT+'OBV',Vol+IncVol,1,0,eCash); {Update
the Custom Quote Price}
end;
{****MAIN PROGRAM****}
begin
if who=8
then Start;
if who=9 then Stop;
if who=99 then
ProcessTrade;
end;
Click the #8 menu to Start the monitoring of tick volumes
for the symbols set up in the Start procedure.
Click the #9 menu
to Stop the processing of ticks.
Statements like this add a symbol to the Alert form, but do not
set any price alerts, although such could be done.
Alert('IBM',FindMarket('IBM'),0,0);
{Create generic Alert for IBM}
Each symbol needs to be in the Alert form because that alert list
is used by the AlertEvent function to fire a call to ESPL when
a tick is received for any symbol on the alert list. The
following statement sets up the trigger to call ESPL with a value of
99 loaded into the global Who variable.
AlertEvent(eTrade,99);
{Start AlertEvent}
Therefore, in the Main Program, Who is tested
for a value of 99 to route execution to the ProcessTrade
procedure. The symbol which fired the AlertEvent call is
passed in the global IT variable. This
variable is used to construct a custom symbol used to total the On
Balance Volume data. If the symbol is a Future, the
incremental volume will be either the AskSize or the BidSize.
For stocks the incremental volume is the trade volume. Results
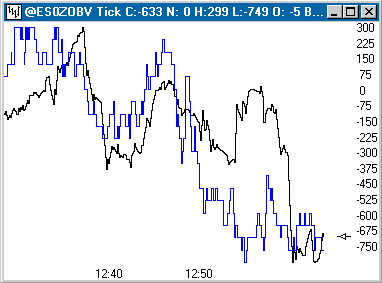
from the script are illustrated using the @ES0Z symbol on the DTN
data feed in this image.

This tick chart shows the On Balance Volume plotted as the host
chart in black, and the @ES0Z prices are overlaid in blue.
Naturally there will be perfect time sync between these
two tick charts because each @ES0Z tick created a corresponding
on balance volume tick. Also, it seems logical that in a
rising market more trades will be at the ask price, and the on
balance volume plot should ascend. And, in a falling
market more trades will be at the bid price, and the on balance
volume plot should descend. Whether there is some
advantage to be gained by having a plot of the On Balance Volume for
tick charts, as illustrated above, is yet to be determined. I
am unsure what customers are looking for, but by providing these
additional tools, research can be done. If there is something
significant to be found, one or more of our advanced users will
discover it and hopefully share with all of us.
Feature Tip:
Printed Chart
Message
by Howard Arrington
Four lines of text can be printed at the bottom of a printed
chart. This text might be used to display a message, market
commentary, copyright notice, disclaimer, or company address.
The text to be printed will be read from an ASCII text file named
C:\Ensign\Message.txt. This simple ESPL script illustrates how
the contents of the Message.txt file can be created or changed prior
to printing a chart. This script is designed to execute by
clicking the #9 menu or the #9 button on the script editor form.
{----- MAIN PROGRAM
-----}
begin
if Who = 9 then begin
Output(eClear);
{erase the output window}
writeln('Ensign
Software');
{write 3 lines of text}
writeln('113
Stillwater Drive');
writeln('Idaho Falls,
ID 83404');
Output(eSave,'Message.txt');
{save to the Message
file}
Chart('IBM.D');
mnuPrintWindow.click;
{print the chart}
mnuCloseWindow.click;
{close the chart}
Output(eClear);
{erase the output window}
writeln('First line
of commentary'); {write a new message}
writeln('Second line');
writeln('Third
line');
writeln('Fourth
line');
Output(eSave,'Message.txt');
{save to the Message file}
Chart('CSCO.D');
mnuPrintWindow.click;
{print the chart}
mnuCloseWindow.click;
{close the chart}
end;
end;
|