April 2001Globex Tip:
Globex Currency Symbols
by Howard Arrington
On 03-25-2001 Globex started using these symbols for
currencies. The Globex currency symbol trades
side-by-side with the regular CME symbol. The Globex
symbols typically use the first letter of the CME symbol, preceded
by a digit 6. There is also an e-mini contract for the
Japanese Yen and Euro Forex that uses a digit 7.
6B British
Pound
6C Canadian
Dollar
6J Japanese
Yen
7J mini Japanese
Yen
6S Swiss
Franc
6A Australian
Dollar
6E Euro Forex |
7E mini Euro
Forex
6F French
Franc
6M Mexican
Peso
6N New Zealand
Dollar
6R Russian
Rubble
6Z South African
Zulu
6L Brazilian
Real |
Example: 6B M1 is the Globex
British Pound, June 2001 contract.
The Globex currency symbols trade in the same price range and
decimal placement as their CME counterparts.
Trading Tip:
Pyrapoint Update
by Howard Arrington
The January
2001 issue of Trading Tips had an article on the
Pyrapoint tool. The example used in that article was the JNPR
daily chart. I thought you would like an update on how
JNPR has continued to walk the Pyrapoint framework of diagonal trend
channels, horizontal support and resistance levels, and turns
occurring on vertical lines at the end of squares. The
summary statement given in the January article is repeated
here. The more you study the example, the more impressed I
think you will be with this tool.

Our January example was through the end of the 5th
square marked by the 62 to 59 vertical blue line. I was amazed
at how JNPR walked down the red diagonal lines to turn on the -1800
horizontal (tenth rotation of 180 degrees) and at the end of the
12th square marked by the 119-116 vertical line on April 3rd.
The actual low day was April 4th. Amazing
indeed! (Sorry the closeness of the bar spacing causes
the 120 label to overwrite the 116 label which is below the low
turning point.) Please reread and review the
material about Pyrapoint in the January
2001 issue.
Study Tip:
Color Band Tool
by
Howard Arrington
 Ensign Windows has a flexible Color Band tool whose primary
use is to indicate bar relationships. Several examples
will be shown to open your mind to the possibilities that this tool
might serve in your technical analysis. Ensign Windows has a flexible Color Band tool whose primary
use is to indicate bar relationships. Several examples
will be shown to open your mind to the possibilities that this tool
might serve in your technical analysis.
Color Band is the last entry on the bottom of the drop down study
list.
The parameter form has three combo boxes: Study, Location,
and Style.

The Study list has 21 predefined color band studies, and the
ability to implement additional studies in the ESPL programming
language. (Examples follow).
The study can be plotted in 14 different locations using 10
different styles. This gives the tool extreme
flexibility.
The following examples show two to four color bands
added to a chart to illustrate the wide variety of visual effects
possible with this tool.
|

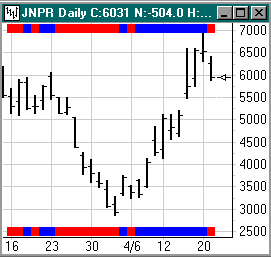
Trends | Top Row 1 | Band
Triple
Trends | Bottom Row 4 | Band Triple
|

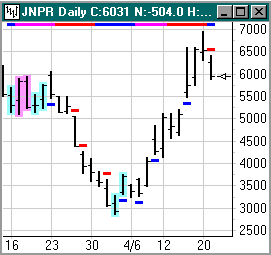
Week by Week | Top Row 1 | Band
Key
Reversal Pair | Highlight
Gap Open | High or Low |
Band
|
|

Trends | Top Row 2 | Circle
Net
Change | Top Row 2 | Bullet
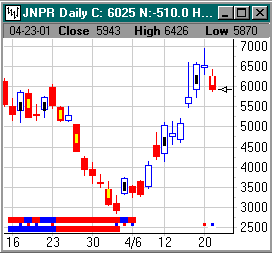
Large/Small Volume | Bottom Row
1 | Arrow
|

Inside/Outside Range | Top Row 1 |
Diamond
Turning Points | High or Low | Band Double
Gaps
| Highlight
|
|

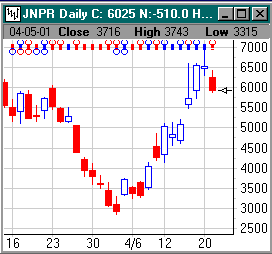
Close Outer 10% | Midpoint | Bullet
Triple
Small Trends | Bottom Row 1 | Band Double
Turning
Points | Bottom Row 2 | Bullets
Large Trends | Bottom Row 4
| Band Double
|

Close Outer 25% | Top Row 1 |
Circle
Close vs. Open | Top Row 2 | Bullet Double
Key
Reversal Pair | Top Row 4 | Circle
|
As has been shown, the available studies, locations
and styles allows one to add a wide variety of visual effects to the
chart. The ability to implement proprietary logic for the
Color Band tool will be illustrated next.
When Study is set to the top choice of ESPL Study, the
ESPL Who = edit box appears so a value can be assigned to the global
Who variable. This variable is used to parse execution
to the appropriate procedure that will set the color for each bar
position on the chart. The user sets the color value,
and Ensign Windows will draw the color band using the color,
location, and style settings. Setting a color value of
zero will tell Ensign Windows to do nothing at this bar
position. Assign a color value of 1, 2, 3, or 4 to use
one of the 4 colors set on the Color Band parameter
form. Any color can be assigned, and one could use the
predefined color constants such as clRed and clYellow.
var j: integer;
begin
if who=61
then
for j:=BarBegin to BarEnd
do
if
High(j)>High(pred(j))
then
SetStudy(0,0,1,j)
else
SetStudy(0,0,2,j);
if who=62
then
for j:=BarBegin to BarEnd
do
if
Low(j)>Low(pred(j))
then
SetStudy(0,0,1,j)
else
SetStudy(0,0,2,j);
end;
This script implements two very simple Color Band tests.
For one of the color bands, the ESPL Who = parameter is set to
61. For the 2nd color band tool, the ESPL Who = parameter is
set to 62. Thus, both tools can call the same ESPL
script and yet be routed to separate logic that implements each
tool.
The code loops through all bars for the chart which made the call
to ESPL. Arrays hold the chart bar values and these can
be used in formulas. The Who = 61 tool tests to see if a bar's
High is higher than the preceding bar's high, and if so, sets the
color band to use the 1st color. If the test is not
true, the color band uses the 2nd color.
The Who = 62 tool tests to see if a bar's Low is higher than the
preceding bar's low. If true, the 1st color is used, otherwise
the 2nd color is used. This is the visual effect for
these two Color Band studies applied to a chart using the Top Row 1
and Top Row 3 locations, and the Band Double style.

When both bands are blue, the bar has a higher high and a higher
low and is ascending. When both bands are red, the bar has a
lower high and a lower low and is descending. A blue top
with a red bottom indicate an outside range bar. A red top
with a blue bottom indicate an inside range bar.
Color Bands are a great tool for marking bar relationships.
Because it can be programmed with proprietary rules, there is no
limit to the creative possibilities for indicating formations and
relationships with a flexible and pleasing visual
presentation. Enjoy it, and be sure to use it.
|