May 2004
Trading Tip:
Bradley Model 2004 Update
by
Howard Arrington
An article about the Bradley Stock Market Model was published in
the November
2002 issue of Trading Tips newsletter. Now that 18 months
have gone by, it is time for a follow up article to document the
correlation of the Bradley model with the stock market.
The Bradley model is a forecast of the market based on
astrological relationships. Because astrological
relationships can be defined with mathematics, the Bradley forecasts
can be made decades in advance.


The correlation has been excellent for the past
several months. The timing of the bottom turn in November 2003
was great, as was the timing for tops in February and April
2004. The following chart shows the Bradley model for the
balance of 2004, which is basically a downtrend to a turn in January
2005. The model suggests a rally from Labor Day through
Election day.

It needs to be emphasized that the Bradley model does
not give price levels. It denotes patterns, trends and
the timing of swing tops and bottoms. The Bradley data
are numbers ranging from -200 to 200. This data is
rescaled and repositioned vertically on the Dow Jones Industrial
chart to create the examples.

Update:
Ensign Internet Symbol Universe
by Howard
Arrington
The Ensign Internet version will download daily, weekly, and
monthly data from the Internet for stocks, futures, and indices on
the following exchanges. The stock data for some symbols goes
back several decades. For example, the daily, weekly and
monthly data for IBM is from January 1962.
Stock Exchanges: AMEX, Amsterdam, Australia,
Barcelona, Berlin, Bern, Bilbao, Bombay, Brussel, Buenos Aires,
Calcutta, Caracas, Copenhagen, Dusseldorf, EBX, Frankfort, Hamburg,
Hanover, Hong Kong, India NSE, Ireland, Jakarta, Karachi, Kosdaq,
Korea, Kuala Lumpur, London, Lisbon, Madrid, Mexico, Milan, Munich,
NASDAQ, New Zealand, NYSE, Oslo, OTC BB, Paris, PCX, PHLX, Pink
Sheets, Shanghai, Shenzhen, Singapore, Stockholm, Stuttgart, Taiwan,
Tel Aviv, Toronto, Thailand, Vancouver, Vienna, Xetra.
Futures Exchanges: CBOT (including eCBOT), CME
(including GLOBEX), COMEX, EUREX, EuroNext, IPE, KBOT, LME, LIFFE,
MGE, NYBOT, NYMEX, SGX, WCE.
Ensign Internet can also download tick data for today and
intra-day data for the last 4 months for the Futures exchanges,
Indices, and for the AMEX, NYSE, NASDAQ, and Canadian stock
exchanges. The tick data can be used to maintain constant tick
charts, Momentum
bars (constant range), and constant volume bar charts. The
intra-day data can be in any minute interval.
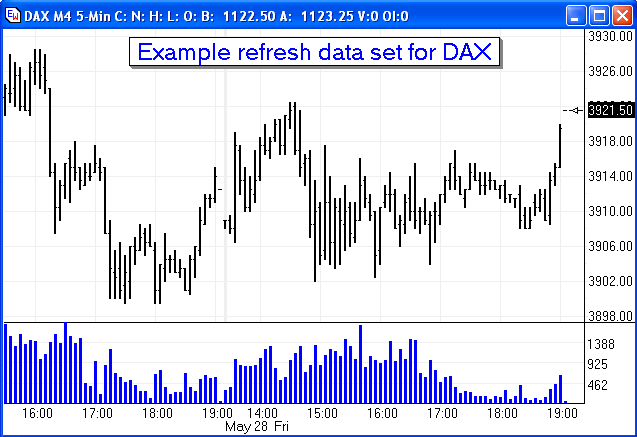
This same capability to obtain data from the Internet is
available in Ensign Windows for the Interactive Brokers data
feed. Thus, IB users will be able to refresh (backfill)
constant tick, Momentum, constant volume, intra-day, daily, weekly,
and monthly charts for most of the popular futures and index
symbols, including ES, NQ, ER2, YM, ZB, ZN, CHF, JPY, EUR,
DAX, ESTX50, $INDU, $COMP, and $NDX.

Trading Tip:
Momentum Bars
by Jay
West
'Just wanted to drop you a note about the new constant Volume and
Range Bar (Momentum Bars) setups. I have tried both on
different trading vehicles and at different settings. I find
both to be superior to the normal interval bars that I used in the
past. I personally enjoy the Range bars best. I like the
fact that there is a new bar when the range of the current bar is
exceeded and I can set that range any way I want. I can tailor
the action to the trading vehicle and personality of the
market. It makes the bars smoother and gives improved
entries. I also noticed that they tend to make the indicators
work better.
One of the hardest things a trader must deal with in my opinion
is the length of the bars on a 3 or 5 min chart. I recently
saw a 15 point opening bar in the ER2 using a 3 min chart and there
are many times that I see 3 and 4 point bars. I had an R75
chart up at the time of the 15 point bar on the three minute chart
and it was too rapid to trade but it got my attention. When I
run a 3 minute chart and an R75 chart side by side I often see the
3-min chart produce a single 3 point bar. The R75 gives me
three bars. There is a large difference between interval bars
and the new Range bars. Now when I get a 3-point bar on the
3-minute chart that would be untradable for me, I can now trade it
because I will get several bars using a Range bar setup that phases
me into the trade. It gives time for the indicator to react
and provide a signal. The Volume bars also tend to make things
smoother and I am still looking at ways to use these to improve the
trading. Being able to control the volume in each bar is very
helpful.
The first chart depicts the ES R100 (100 point range bar) and the
2nd chart is a 3-minute chart. The R100 chart is much smoother
and more tradable than the 3-minute chart.


Thanks for the great Ensign program. It is the best trading
program I have ever used. |