November 2004Trading Tip:
Relative Strength Index Trend
by Howard Arrington
We have all heard the adage 'A trend is your friend'. One
way to use this to one's advantage is to have a tool that identifies
the direction of a trend, and then only take trades in the same
direction as the trend. If the trend is up, only signals for
long trades are taken. If the trend is down, only signals for
selling short are taken.
There are many uses for the Relative Strength Index (RSI)
study. Most focus on looking for divergence between RSI and
the chart action. Click this link for more information
about the Fundamental
Behavior of RSI. But this article will show how to
use RSI in a different way. RSI will be used to indicate
whether the market is trending and its direction.
The rules which define the RSI Trend indicator are:
- Use a 9 period parameter for the RSI study
- An Up Trend will start with RSI crossing above 70, and
- The Up Trend continues while RSI remains above 40.
- A Down Trend will start with RSI crossing below 30, and
- The Down Trend continues while RSI remains below 60.
This RSI Trend indicator can be implemented in Ensign Windows
using the RSI study and 6 Alert objects.

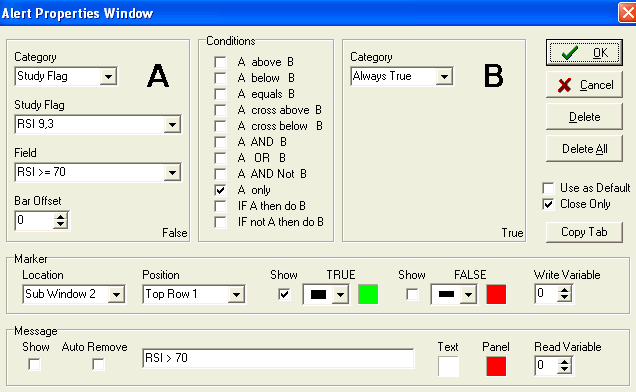
Four of the alerts are used to track the RSI conditions of RSI
>= 70, RSI >=60, RSI <=40, and RSI <=30. These
alerts and then used to turn on or off the Green and Red zone
coloring. Only one of the property forms for these 4 alerts is
shown here. The other 3 are similar, with a different Field
selection in panel A.
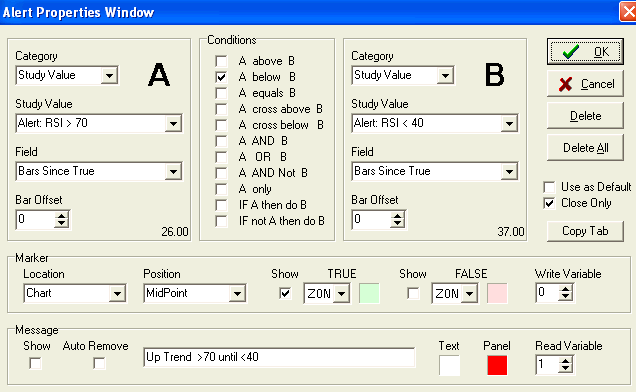
The next Alert is the logic for the Up Trend and
creates the green zone coloring on the chart.
The final Alert is the logic for the Down Trend and
creates the red zone coloring on the chart.
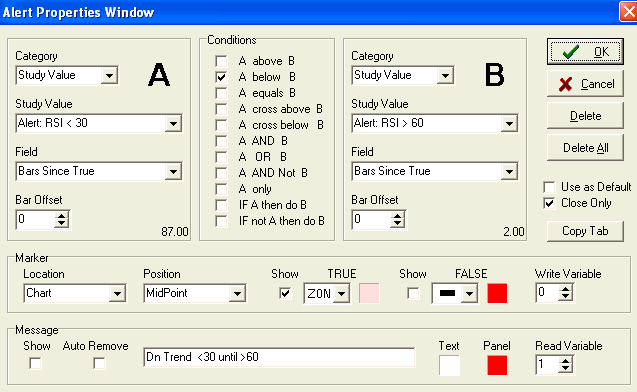
Let's discuss the logic of the last alert in greater
detail. Panel A returns the number of Bars Since
the RSI < 30 Alert was true. Panel B returns the numbers of
Bars Since the RSI > 60 Alert was true. If the Panel A
value is a smaller number than the Panel B value, then RSI < 30
happened more recently than RSI > 60. Therefore, the Down
Trend is still in effect and a light red ZONe marker is used to
display this True condition.
Likewise, the Up Trend is in effect as long as the RSI
> 70 event happened more recently than the RSI < 40
event. That is the logic tested in the previous alert the does
the light green zone coloring.
A template for the RSI Trend indicator can be
downloaded from the Ensign web site. Click menu File | Open |
Internet Services. Click the Upgrade tab. Click the
Template bullet and select RSI-Trend in the drop down
list. Click the Download button to get the template.

Trading Tip:
Study Consensus
by
Howard Arrington
This article will show how a Buy or Sell signal can be generated
when three studies agree with each other. The purpose of the
article is to show how consensus among studies can be
determined. No claim is being made that the signals are
profitable.
Our example trading system will use input from three
studies: Relative Strength Index (RSI), Stochastic Momentum
(SM), and two Moving Averages (MA). The study signals
are defined as:
- Buy when 3 period MA > 17 period MA, Sell when 3 period MA
< 17 period MA.
- Buy when SM > Ave(SM), and Sell when SM < Ave(SM).
Use 10 Bar, 25, 2, 7 averages.
- Buy when RSI > 60, and Sell when RSI < 40.
Use a 7 period RSI parameter.

The 3 period moving average is plotted in Green on the chart when
it is above the 17 period moving average plotted in Blue. The
3 period MA is plotted in Red when it is below the 17 period MA.
The first study window shows the Stochastic Momentum study
plotted in Green and Red, based upon whether the study is above or
below a 7 period average of the SM plotted in Blue.
The bottom study window show the Relative Strength Index.
It is plotted in Green when it is above 60 and plotted in Red when
it is below 40. Between 40 and 60 the RSI is plotted in
Blue.
Alerts will be used to indicate when all three studies are in
their Buy zone (plotting in green), or in their Sell zone (plotting
in Red). The Buy Signal will be the consensus of all 3
studies showing a Buy signal. The Sell Signal will be
the consensus of all 3 studies showing a Sell signal. The
current state of the studies and their consensus will be shown at
the bottom of the chart. Here is the setup for the six
Alert objects used for the system.

The first alert tests whether the first average line
(3 period) is above the 2nd average line (17 period). When
this condition is True, the Section 1 position at the bottom of the
chart is colored Green and the message 'MA Buy' is shown. When
the condition if False, the Section 1 position is colored Red and
the message 'MA Sell' is shown. The result of this
alert is written to global variable 2 for use later on.
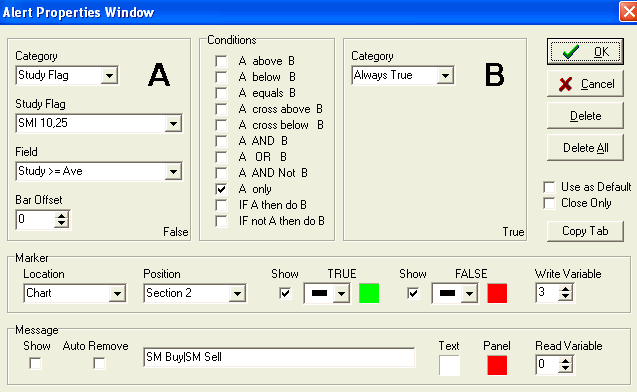
This alert tests the relationship of the SM study to
its average. When SM > Ave, the Section 2 position is
colored Green and the message 'SM Buy' is shown. Otherwise,
the Section 2 is colored Red with the message 'SM Sell'. The
result of this alert is written to global variable 3 for use later
on.
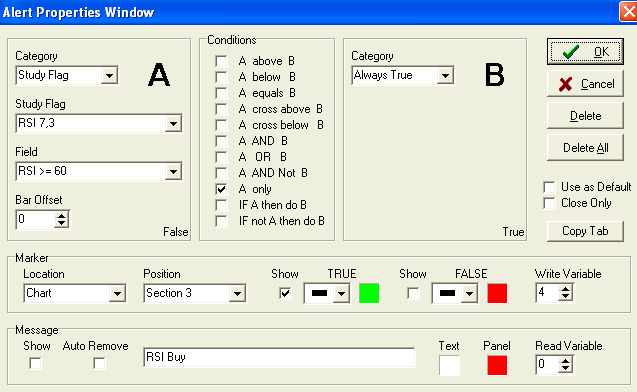
This alert will test for the RSI study being above 60
and color Section 3 Green with the message 'RSI Buy'.
Note, however, this alert does not color the section Red when it is
not above 60. Another alert will be used to color the
section Red when the RSI is below 40. The alert result is
written to variable 4.
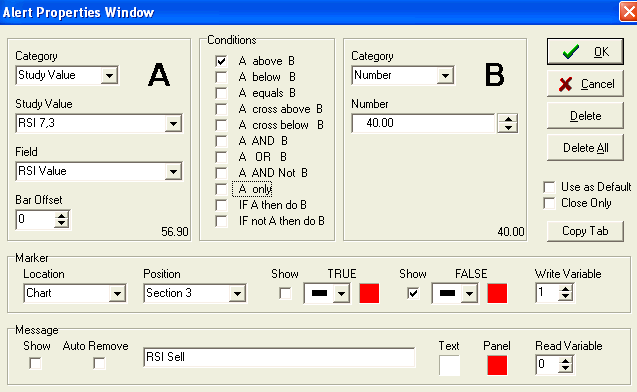
This alert will test for the RSI study being above 40
and color Section 3 Red with the message 'RSI Sell' when it is
False. This is a little different style than what was used in
the previous alert. I want to store in global variable 1 a
False when RSI is below 40 and a True when it is above
40. You will understand the reason for this in the last
alert that generates the consensus Sell signal.

This is the alert that generates the consensus Buy
signal. Three of the alerts wrote their True/False
results into global variables 2, 3, and 4. The Buy consensus
exists when all three of these values are True. The alert uses
the Global Flag category in panel A, to return the Count of the
global variables that are True. The Count True function is
going to count 3 variables starting with Global Variable number
2. When the Count True function returns a value of 3, the
Section 6 position will be colored Green and show the message
'BUY'.

This alert counts the Sell signals which are stored in
3 global variables starting with Global Variable number
1. Remember, variable 1 holds a False when the RSI study
is below 40. This lends itself to being counted with the other
2 signals when they are also False. When global variables 1, 2
and 3 are all False, the consensus signal is shown in Section 6
using a Red color and the 'SELL' message.
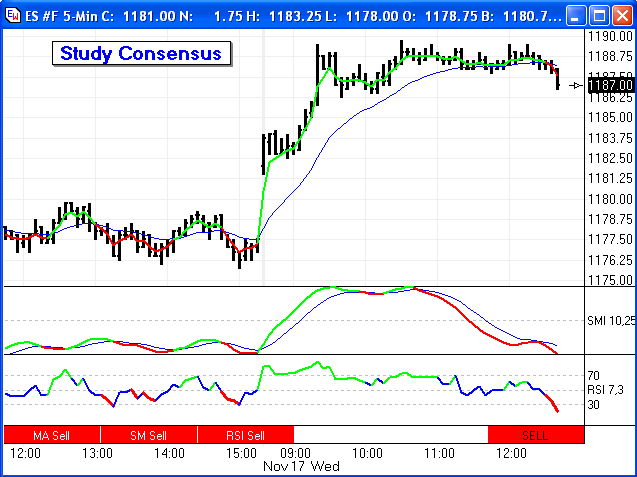
The following chart shows the three sell study signals
on the left, and the consensus SELL signal on the right.
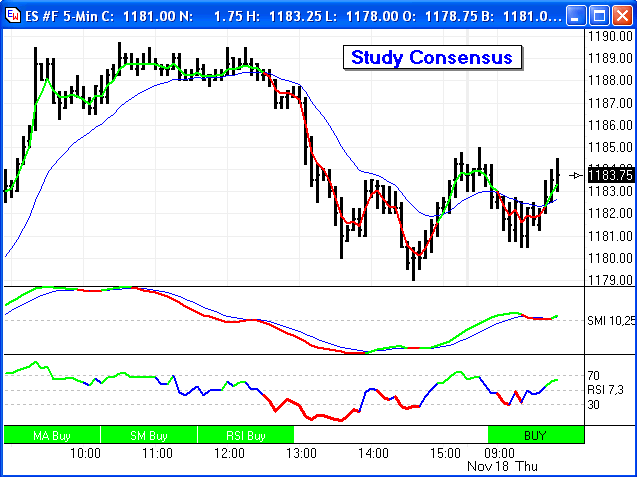
The next chart shows the three buy study signals on
the left, and the consensus BUY signal on the right.
And finally, the next example shows disagreement in
the study signals. One is showing a buy, one a sell, and the
RSI study is neutral because it is between 40 and 60.
Therefore, no consensus signal is shown.

A template for this system can be downloaded from the
Ensign web site. The template is named
Study-Consensus. See the download procedure outlined at
the end of the first article.
Trading Tip:
Historical Volatility
by Howard Arrington
This article will demonstrate plotting an alert value on a
chart. Historical Volatility is a measure of a
security's standard deviation. High volatility values are an
indication of erratic volatile price action.

The alert property form for this example is shown
here.

Panel A uses the Historical Volatility function to
return a volatility value for a 30 bar period of time. This
value is written to global variable 1 because the Condition
selection is 'A Only'. However, the action in panel B is also
performed, which reads the Value from Global Variable 1, multiplies
the Value by the number 4 to resize it, and adds the chart's Scale
Low value. This makes the value in panel B ready to plot on
the chart's scale.
The Marker plots on the chart in the 'B' Value
position, using the thick curve marker token. The curve line
is plotted in Green.
A template for Historical Volatility can be downloaded
from the Ensign web site using the process outlined at the end of
the first article. The template is named
Historical-Volatility.
Trading Tip:
Inside Bar Breakout
by Howard Arrington
The template that implements this idea is named
Inside-Breakout and can be downloaded from the Ensign web
site. The idea implemented by this template uses the
MACD study for direction. When the MACD is above its average,
the High of an Inside range bar is used as a Buy stop.
When the MACD is below its average, the Low of an Inside range bar
is used as a Sell stop.

The Green zone shows where bars are trading above the most recent
Buy stop. The Red zone shows where bars are trading below the
most recent Sell stop.
The following two alerts establish the trend direction based
on MACD being above or below its average.


When the MACD trend is Up, and an Inside bar occurs,
the following alert will copy the Inside bar's High into global
variable 1, and draw a short horizontal green line on the chart at
the High price.

When the MACD trend is Down, and an Inside bar occurs,
the following alert will copy the Inside bar's Low into global
variable 2, and draw a short horizontal red line on the chart at the
Low price.

When a Bar's High exceeds the High Stop in global
variable 1, the zone on the chart is colored light green.

When the Bar's Low is below the Low Stop in global
variable 2, the zone on the chart is colored light red.

|